Smart Pages
Smart Pages lets you build the ride screens you want, with the metrics you choose at the sizes you choose. A page can also carry conditions, so it comes up on its own when the ride changes and gives way again when it passes.
Building and previewing pages is free. Showing them on the ride screen needs Bike IQ Pro. Without Pro your rides use the Default page, which is the same twelve-metric grid Bike IQ has always had.
Where to find it
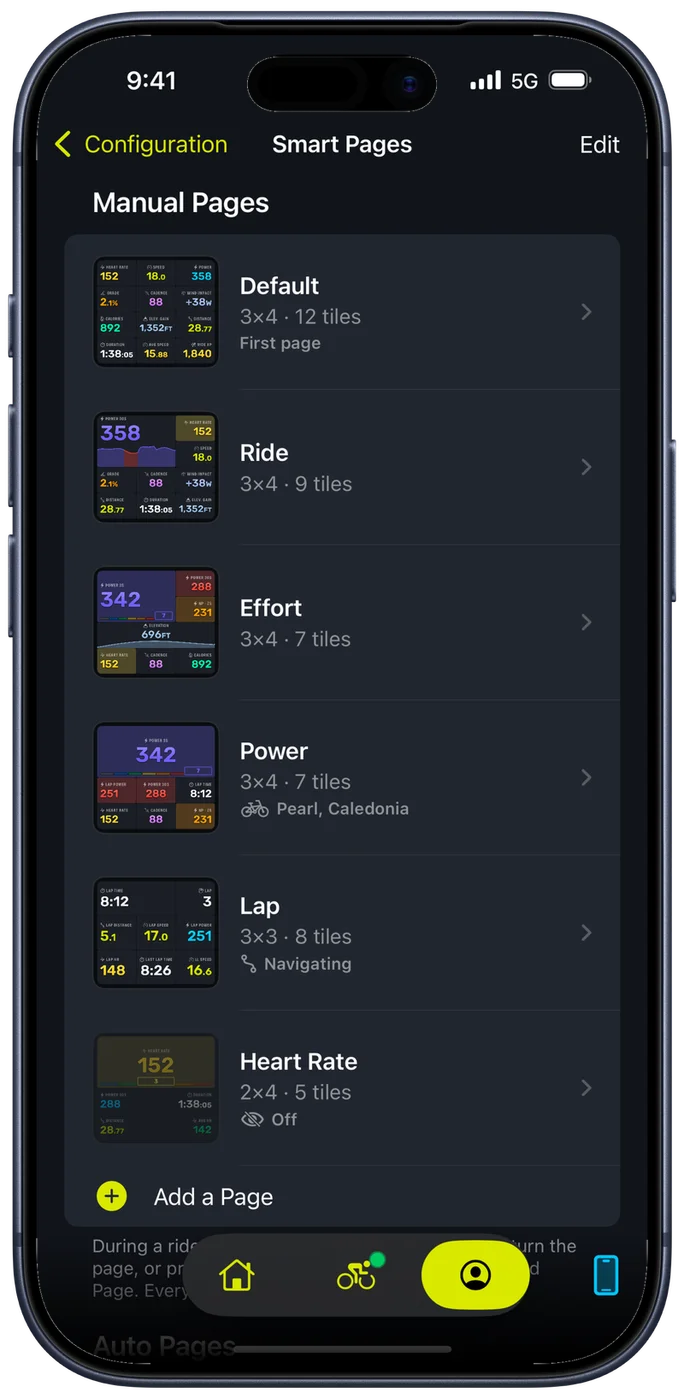
Open your profile, then Ride Settings, then Smart Pages. The screen lists your Manual Pages in the order you ride them, then your Auto Pages.
What you start with
Nothing to set up. Bike IQ starts you with three Manual Pages and three Auto Pages, and the ride screen looks exactly as it always has until the road gives it a reason to change.
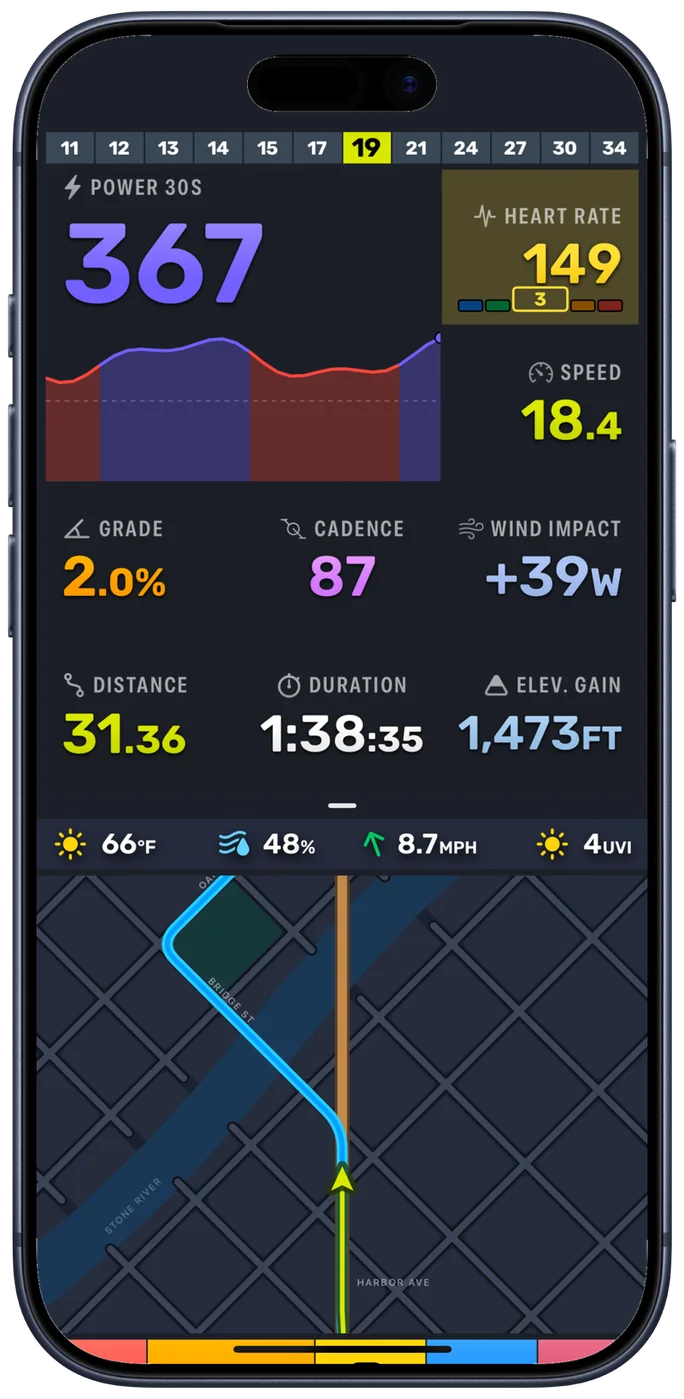
- Default, Ride and Effort are the pages you swipe between. Default is the twelve-metric grid you already know, Ride puts power on a graph beside heart rate and speed, and Effort is power over 3 and 30 seconds with normalized power, each in its zone, over the ride's elevation profile.
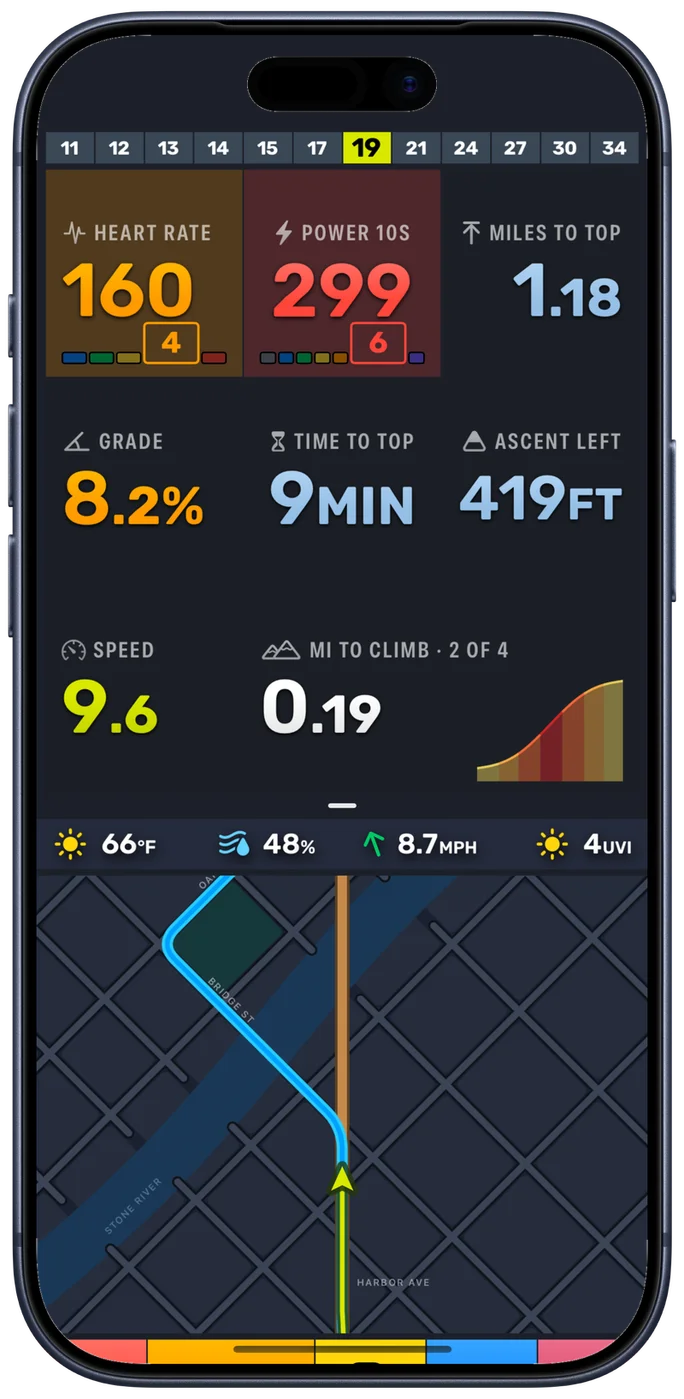
- Climb, Descent and Last Lap are Auto Pages. They are never in the swipe order. They come up by themselves on a climb, on a descent, and for a few seconds after a new lap starts.
Every one of them can be edited, reordered or deleted, and you can start from scratch if you would rather.
Manual Pages
Manual Pages are the ones you turn to yourself. During a ride, swipe left or right on the metrics to move between them, or map a shifter button to Next Dashboard Page and change pages without taking a hand off the bars. Every ride starts on the first page in the list. You can keep up to ten.
New Manual Pages start from a template rather than an empty grid: Essentials for rides without sensors, Power, Heart Rate, Lap and Long Ride. Blank is there when you want to start from nothing.
Auto Pages
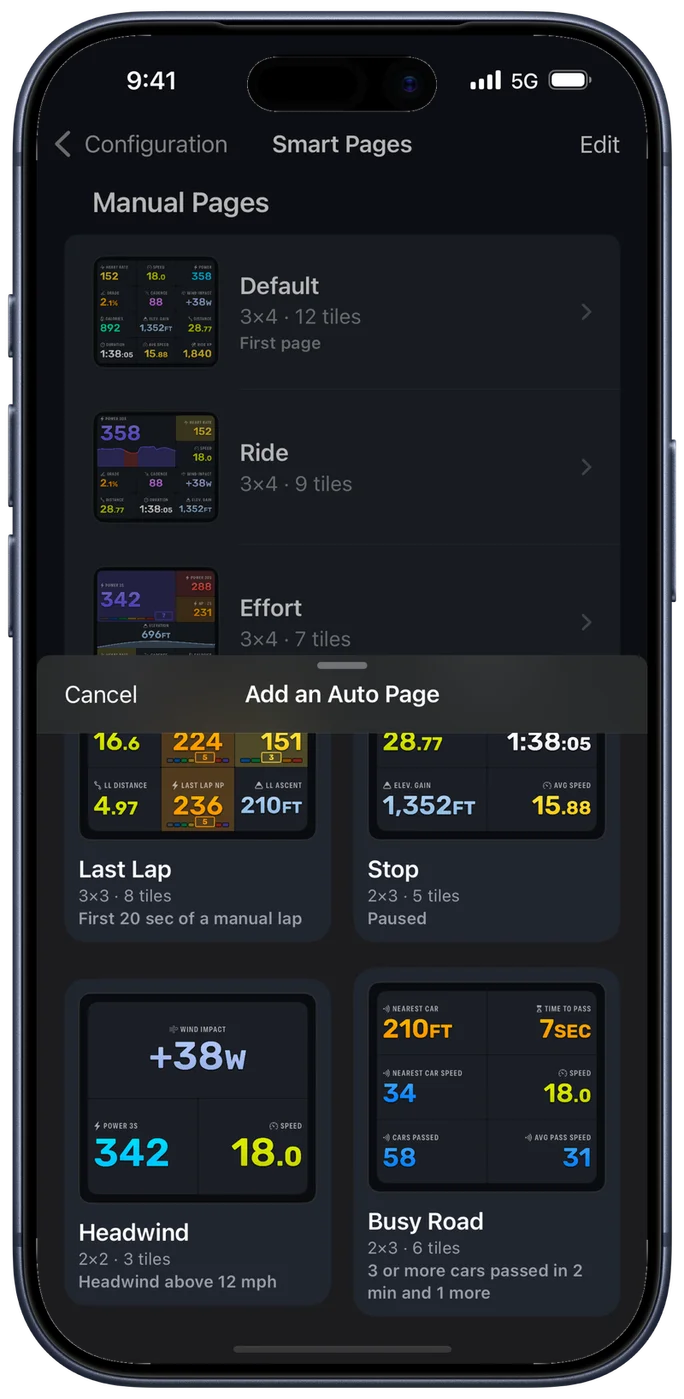
An Auto Page is not in the swipe order. It comes up on its own while its conditions are met, and your page comes back when they end. That is the part that makes the feature worth having: the numbers that matter on a climb are not the numbers that matter in a headwind, and you should not have to go looking for them mid-effort.
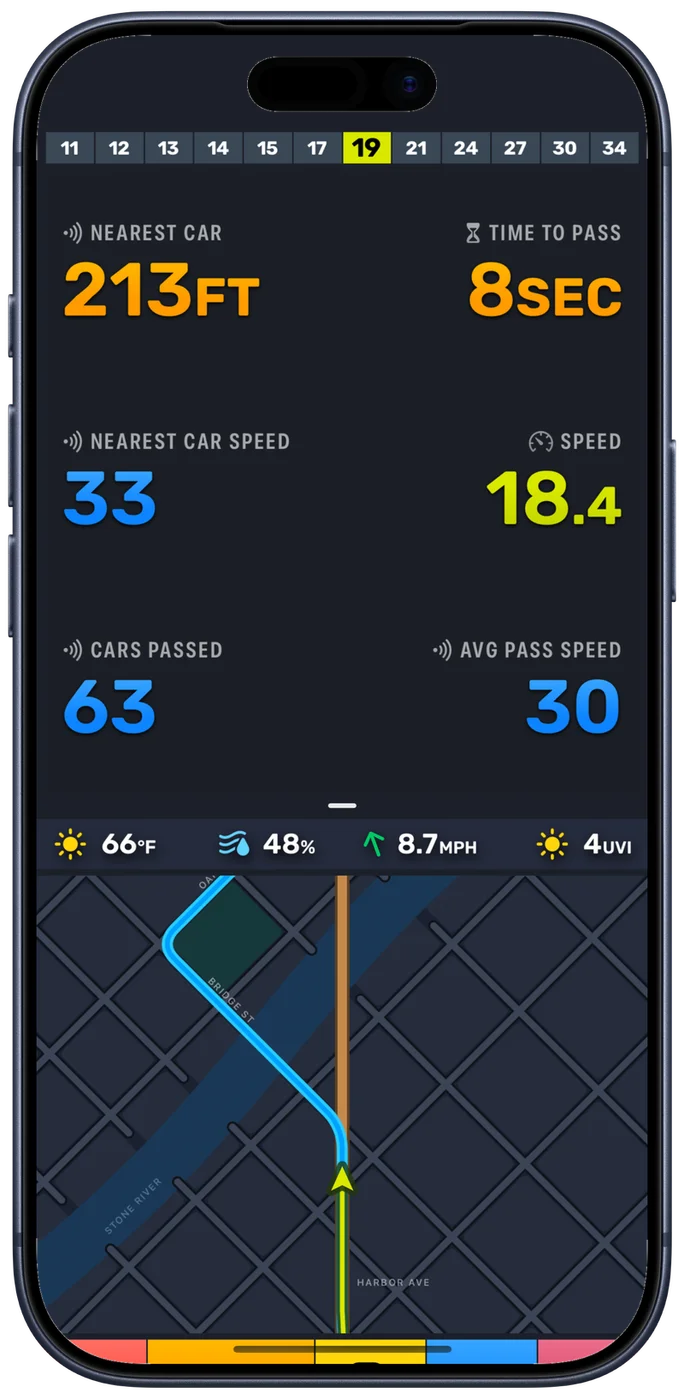
Beyond the three you start with, the templates are Stop, which shows the ride so far and the time while you are stopped, Headwind, and Busy Road, which reads your radar and comes up when a lot of cars have been passing you quickly. Busy Road is only offered once you have a radar set up on a bike. You can keep up to ten Auto Pages, counted separately from your Manual Pages.
Auto Pages never fight you. The earliest page in the list wins if two qualify at once, swiping away a page that came up on its own dismisses it until its conditions end and are met again, and changing pages by hand holds every trigger for eight seconds.
Conditions
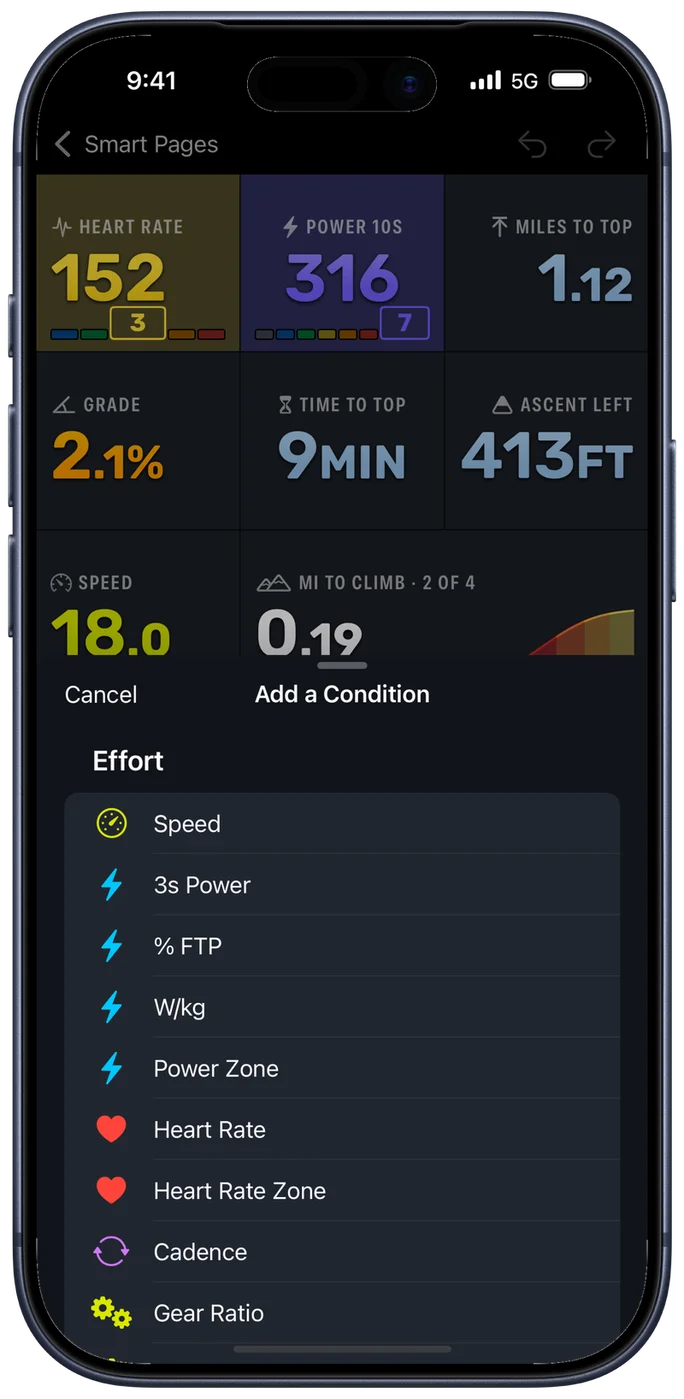
A page can carry up to six conditions, and you choose whether all of them or any of them have to be true. Each one can also require its value to hold for a number of seconds, so a single reading never flips a page.
| Group | Conditions |
|---|---|
| Effort | Speed, 3s Power, % FTP, W/kg, Power Zone, Heart Rate, Heart Rate Zone, Cadence, Gear Ratio, Rear Cog and Front Chainring |
| Terrain | Grade, On a Climb, On a Descent and Climb Ahead, read from the road in front of you |
| Weather | Headwind, Tailwind, Crosswind, Wind Impact, Temperature, Humidity and UV Index, from the forecast and the direction you are riding |
| Navigation | Turn Ahead, Off Route and Destination Ahead, while you are following a route |
| Traffic | Car Behind, Car Close Behind, Car Speed, Cars Passed and Pass Speed. Needs a paired radar, and the group only appears once you have one |
| Ride | Paused, New Lap, New Manual Lap and Moving Time |
| Equipment | Tire Pressure, and the charge left in Any Battery, your iPhone or your groupset, from your phone and the sensors paired to that bike |
You can also set how long a page stays after its conditions end. Most are best at zero, so the page goes the moment the climb does. Last Lap is the exception: it holds for twenty seconds, because the lap you just rode is worth reading.
Where a page shows up
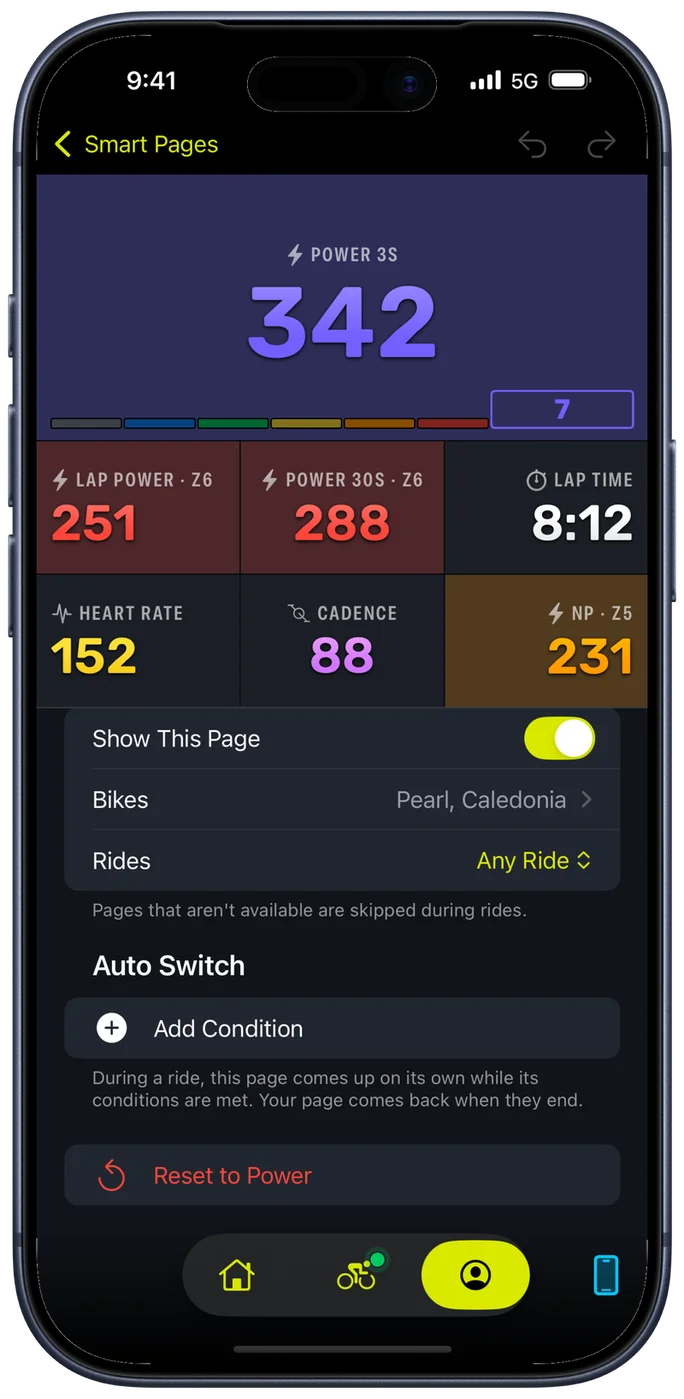
Each page carries its own availability, so a page you only want on one bike stays out of the way on the others.
- Off keeps the page without using it, for one you are still working on.
- Bikes limits it to the bikes you tick in your garage. A climbing page can belong to the road bike alone.
- Rides limits it to Navigating or to Free rides, so a page built around the route ahead only appears when there is one.
Building a page
Choose a grid up to three columns by four rows. Tap a tile to change what it shows, drag it to move it, or drag its corner to make it bigger. A tile can span columns or rows, so the number you care about most can be the size it deserves.
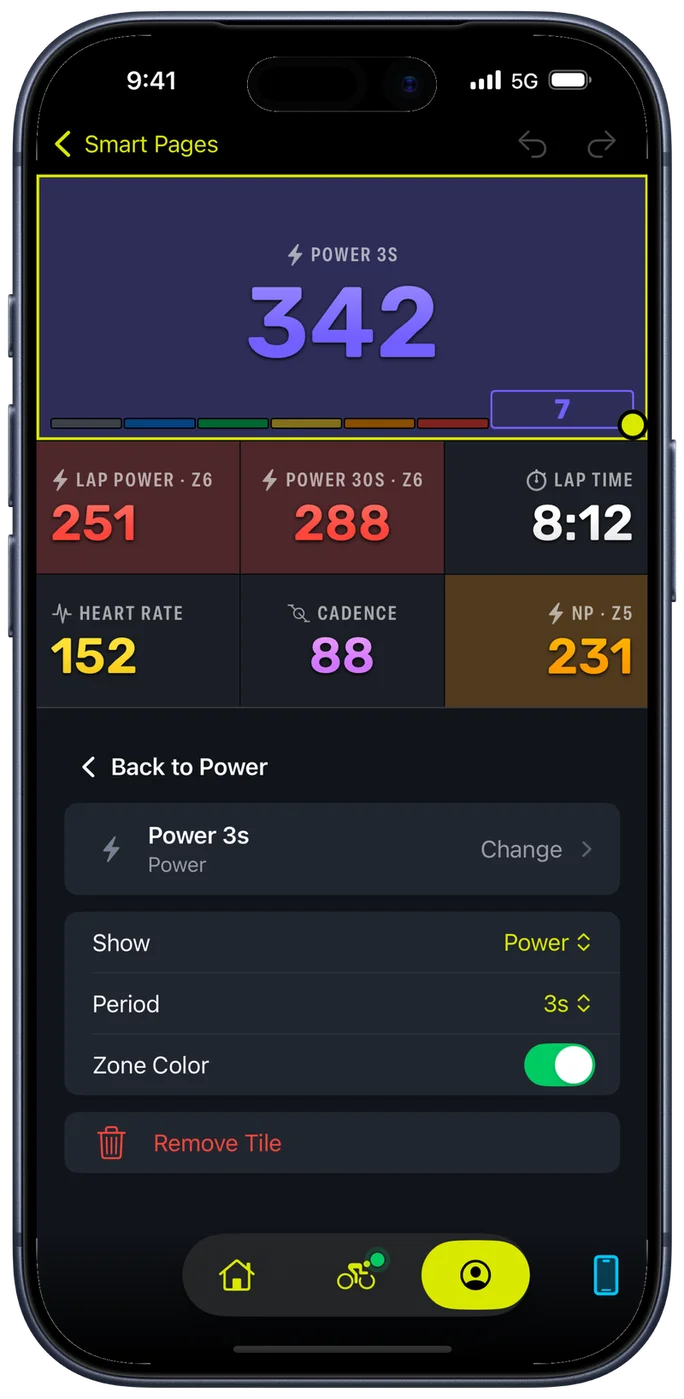
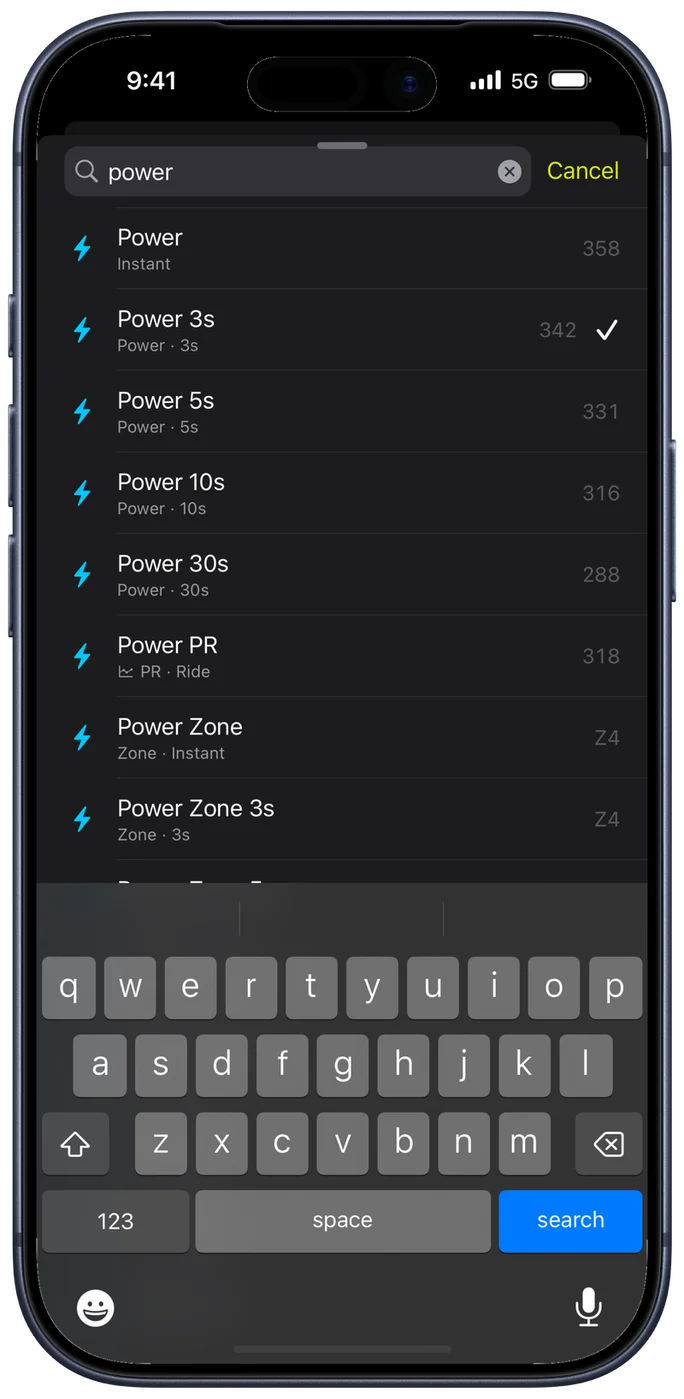
There are more than 150 tiles. Searching the list understands what you would actually call a metric, so looking for "watts" finds power and looking for "cadence" finds every form of it. Most metrics come in more than one form: power alone can be instant, a rolling average over 3, 5, 10 or 30 seconds, a lap or ride average, normalized, per kilogram, as a percentage of FTP, or as a zone.
| Family | What is in it |
|---|---|
| Power | Instant, rolling averages from 3 to 30 seconds, lap and ride averages, normalized, per kilogram, as a percentage of FTP, or as a zone |
| E-Bike | Motor Power, Total Power, Assist Mode and E-Bike Battery |
| Heart Rate | Current, averages, maximum and zone |
| Speed | Current, averages, maximum and the pace you are holding |
| Cadence | Current, averages and maximum |
| Gears | The gear you are in, as teeth, as a ratio, or as its position on the drivetrain |
| Elevation | Grade, ascent, the climb or descent you are on, and the climbs still ahead |
| Tires | Front and rear pressure, together or on their own, and tire temperature |
| Battery | Your iPhone, your groupset, your sensors and your e-bike |
| Distance | Ride, lap and last lap, and what is left of a route |
| Time | Moving and elapsed time, lap count, and the time of day |
| Energy & Wind | Calories, Ride XP and the wind pushing against you in watts |
| Weather | Temperature, humidity, UV and the wind itself |
| Radar | The nearest car and how fast it is closing, and what the road behind you has been like |
The Radar family only appears once you have a radar set up. E-Bike tiles are offered to everyone and read a dash without a drive connected, so you can see what an e-bike would add before you own one.
Tiles that do more than print a number
Most tiles print a number. Some draw something, because the number on its own does not tell you enough.
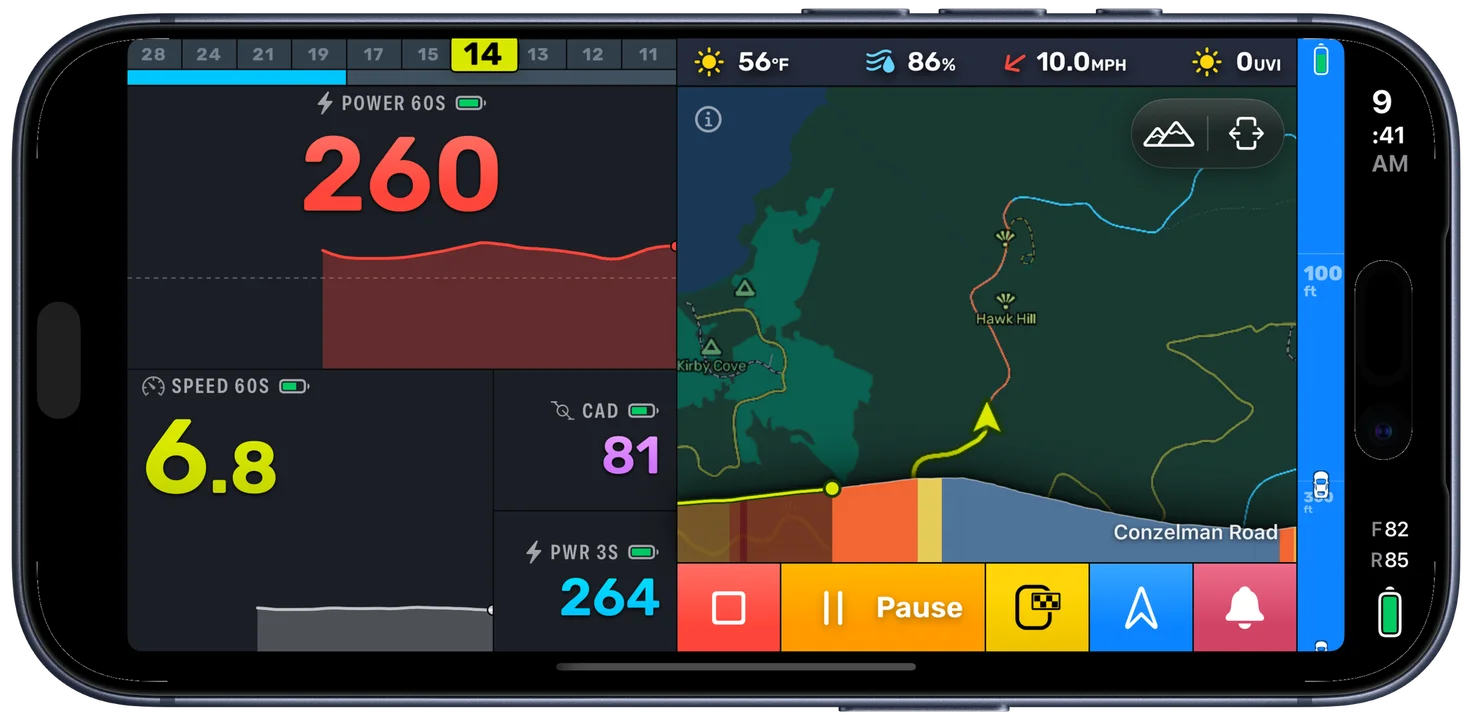
Graphs put the recent history of power, heart rate, speed or cadence under the current value, and the elevation profile of the ride so far. You see the shape of the last few minutes without looking anywhere else.
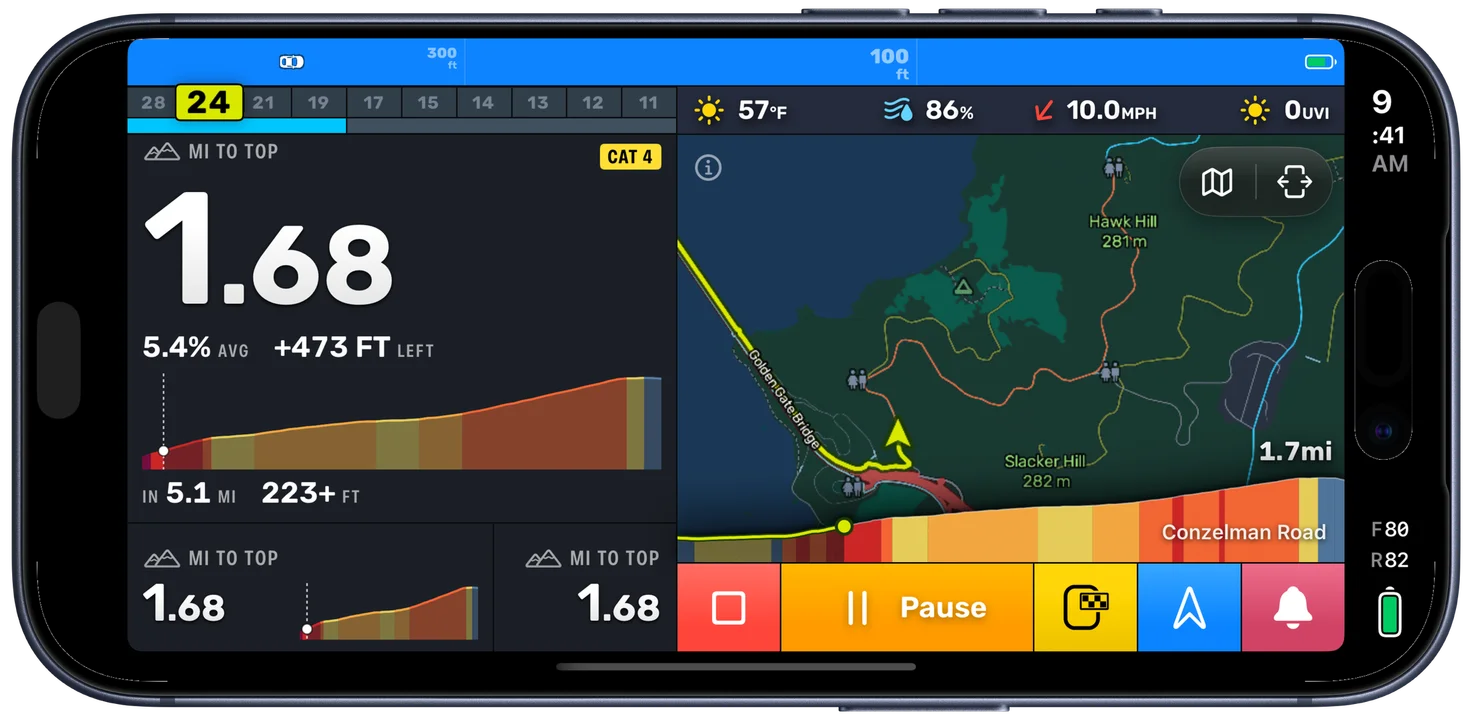
Climbs lists every climb still ahead of you, numbered along a route and coloured by how hard each one is. The hill tiles count down what is left of the climb or descent you are on: Time to Top, Ascent Left, Descent Left, and the VAM you are climbing at.
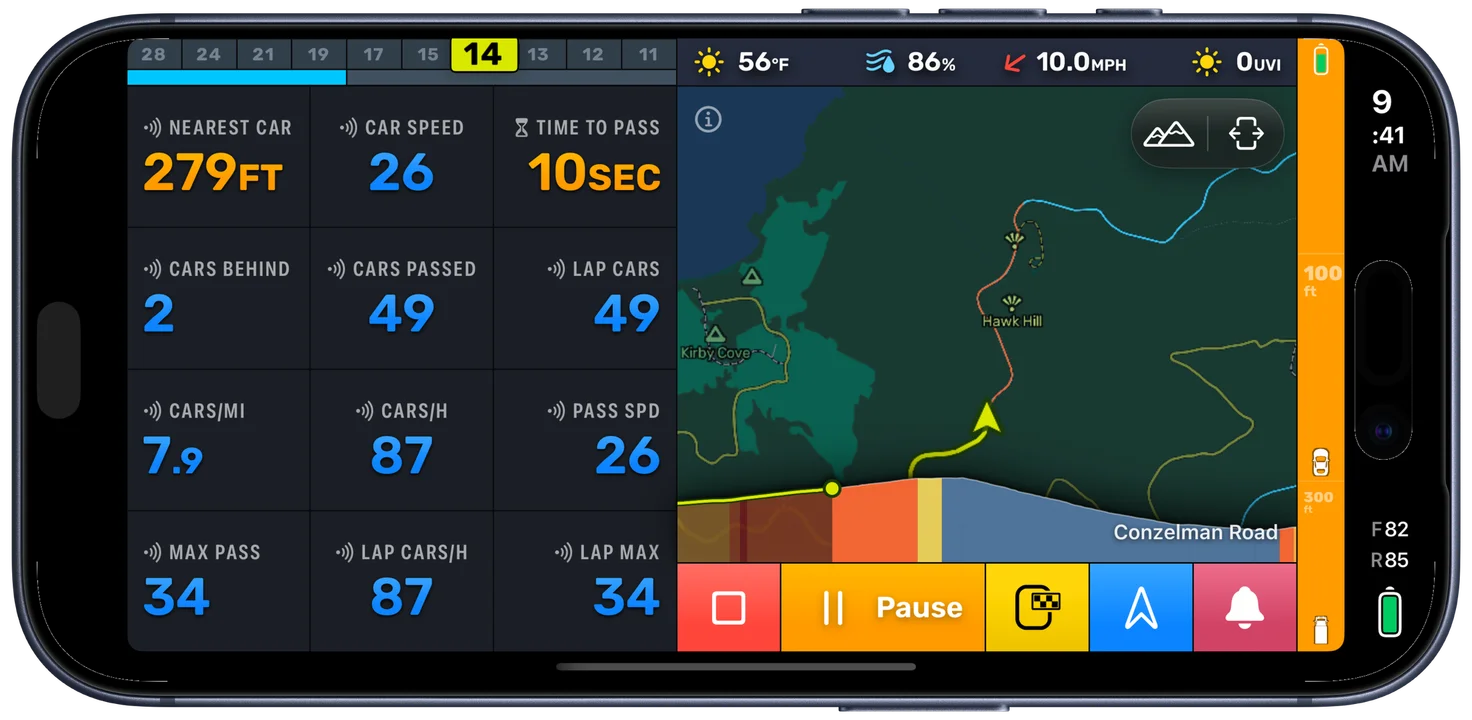
Radar tiles read the road behind you: the nearest car, its speed, how long until it passes, how many cars have passed, how often, and how fast they went by.
Best power and fastest distance track this ride's own records as you go, over the durations and distances Strava measures: your best 30 second, 1 minute, 5 minute and 20 minute power, and your fastest 10 km, 20 km, 40 km and 100 km, in miles too. Power PR and Speed PR draw those as a bar chart against your best of the last three months. Bars you have beaten this ride turn gold, and a new best pulses as it lands.
What is on the page
Only the metric grid is yours to arrange. The map, the weather bar, the gear and coaching bars, the radar strip and the session controls stay where they are on every page, so the parts of the screen you rely on without looking never move.
Related Guides
- Recording a Ride: the ride screen, session controls, and what gets recorded
- Ride Assist: auto-pause, auto lap and the other automatic parts of a ride
- The Road Ahead: how climbs and descents are detected, which the terrain conditions use
- Supported Radars: what the radar tiles and the Traffic conditions read from
- Free and Pro: what Bike IQ Pro adds