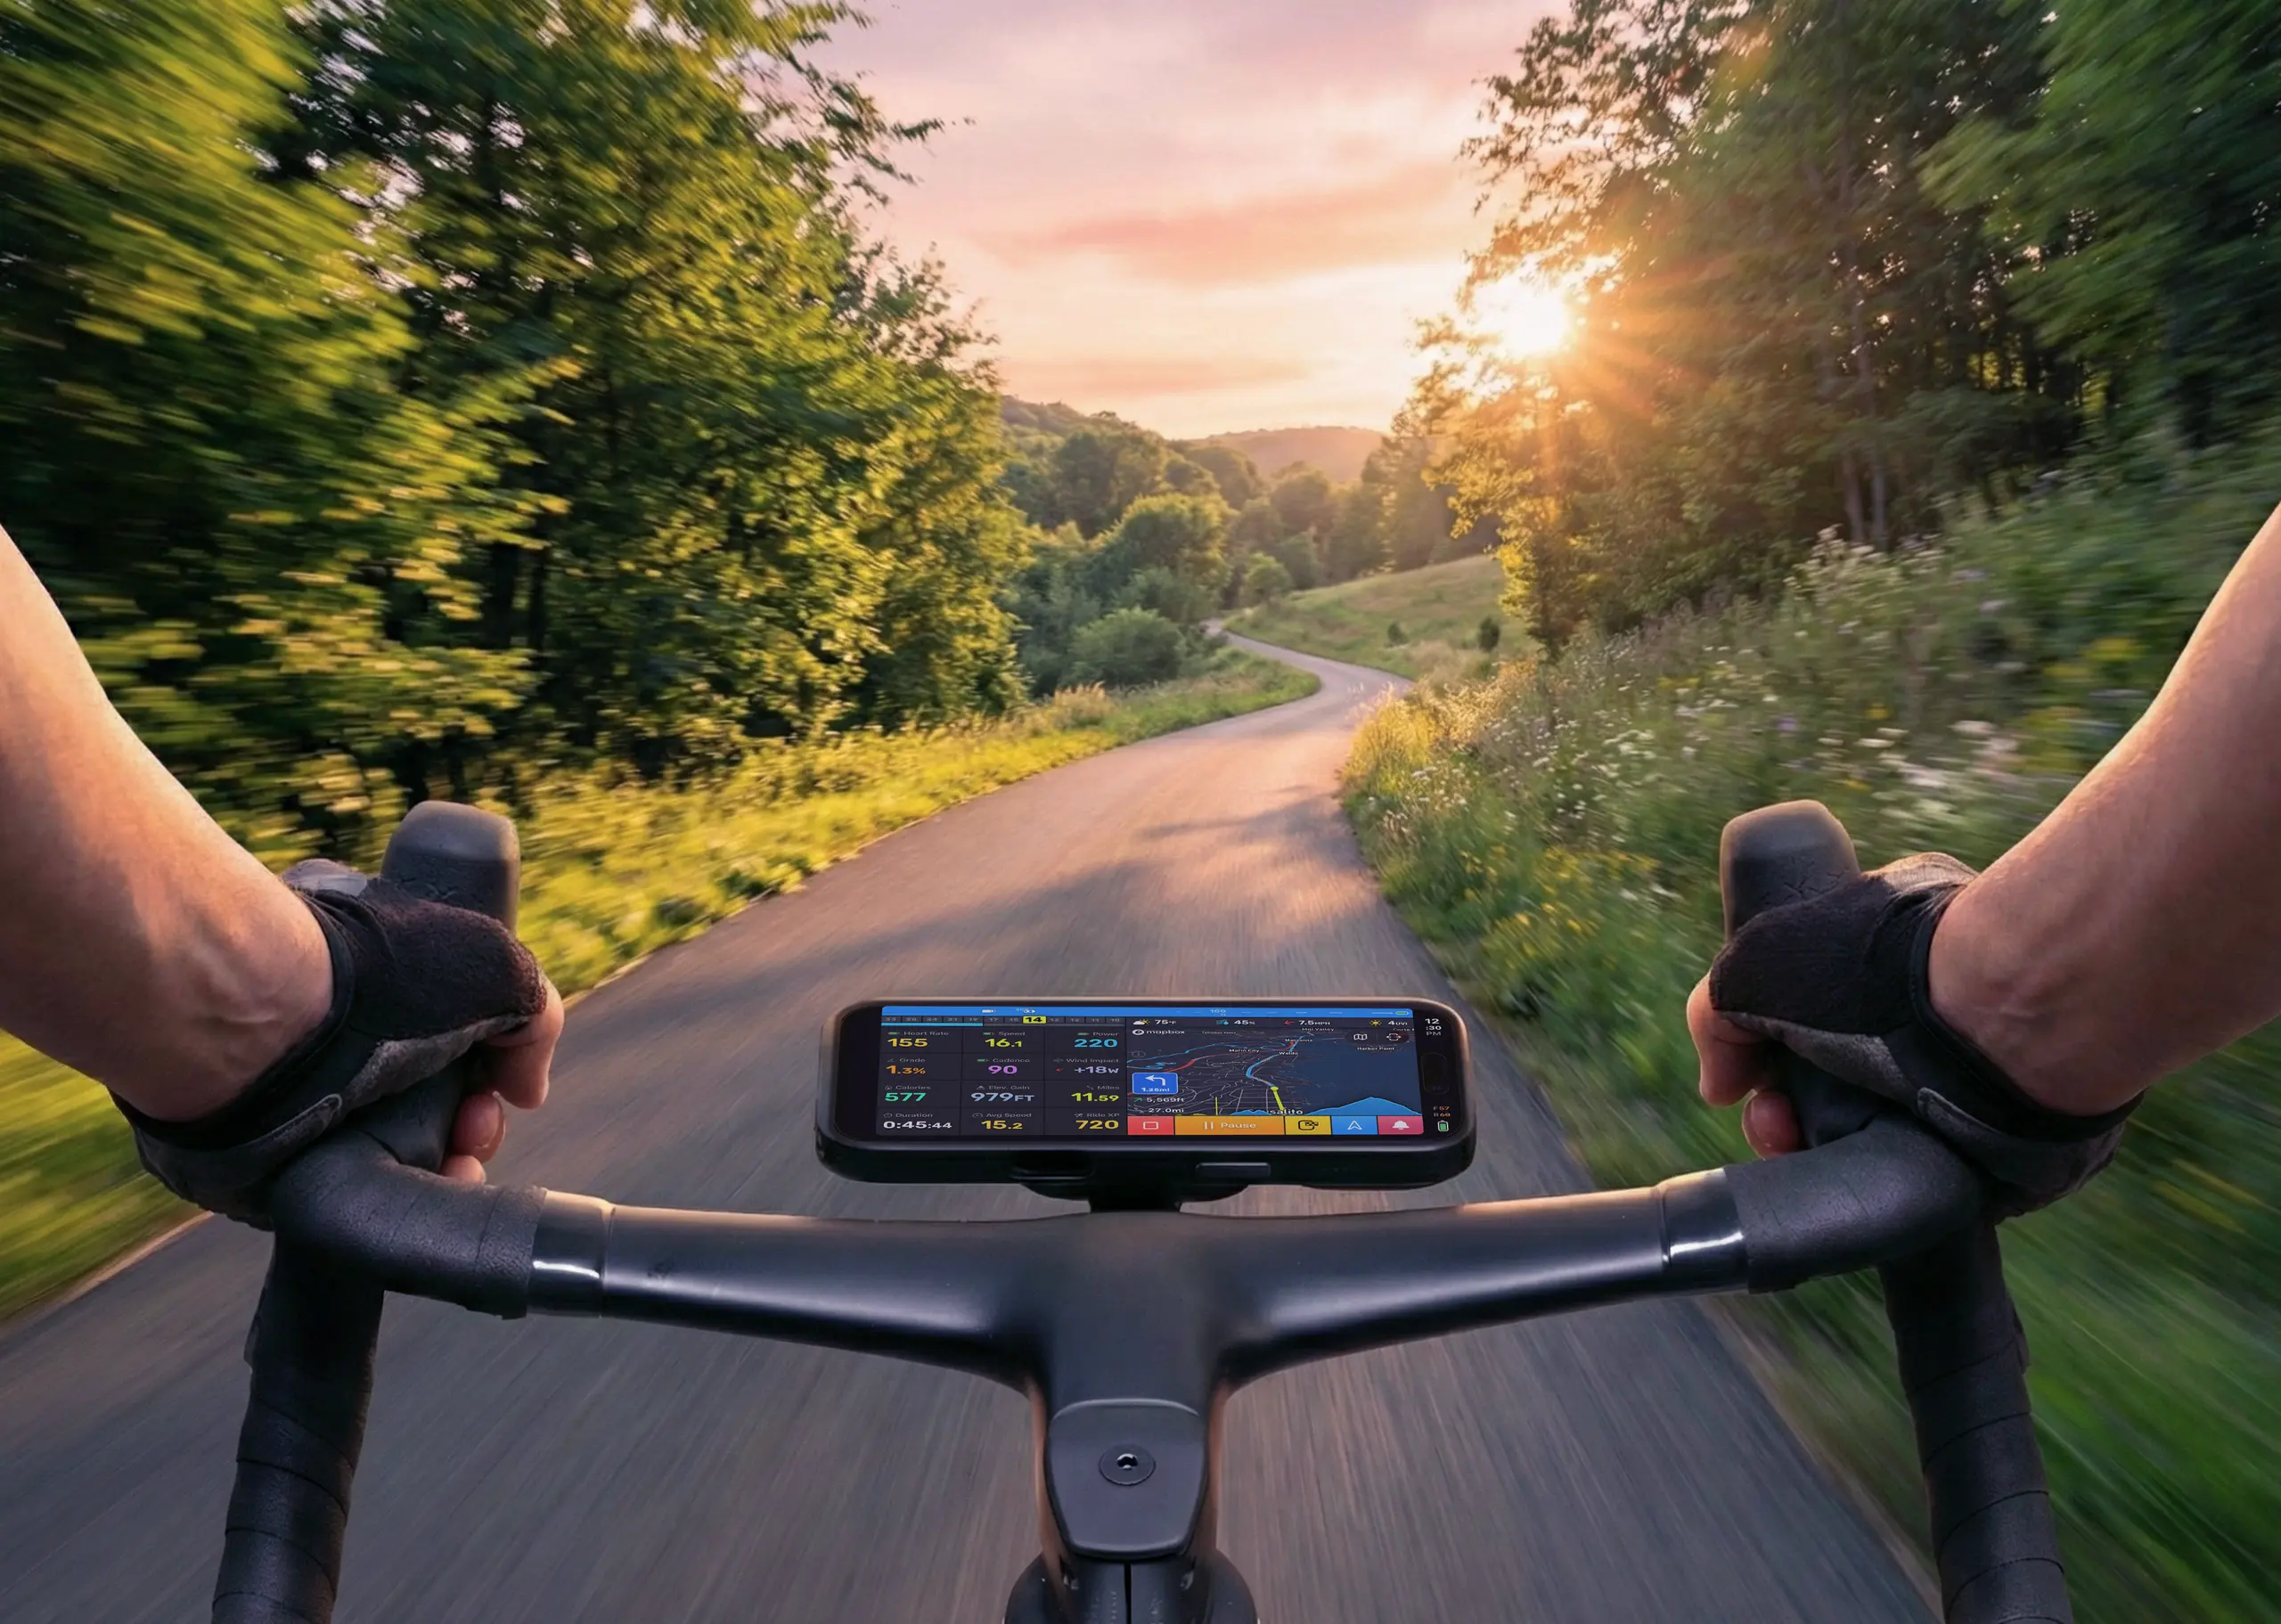
The iPhone
reimagined as a bike computer

Built for real rides
Power, cadence, grade, gears, wind. Bike IQ measures what matters using the sensors already in your iPhone. No extra hardware required.

Accurate grade detection
Grade you can trust, from false flats to steep climbs.

Wind awareness
Understand when wind is helping or holding you back.

Real-time power estimation
A live read on effort, even without a power meter.
Cadence detection
Pedaling RPM from your iPhone's sensors. No cadence sensor needed.
Automatic gear detection
Know your gear as you shift, no electronic drivetrain required.

SRAM AXS & Shimano Di2
Live gears, battery, and shift tracking. Map shifter buttons to app actions.

Sensor compatibility
Power, heart rate, cadence, speed, radar. Use what you have.

Radar support
Rear traffic alerts from 11 radar brands, Garmin Varia included.

Turn-by-turn navigation
Routes from Strava and Ride with GPS, always one turn ahead.

The map never gives way
Change the numbers you read mid-ride. The map stays where it is.
Battery life, solved.
All-day battery life on a single charge. Built for long rides, not short demos.
Running Bike IQ for a full 12-hour ride with no power bank felt like a brave move. I finished with 40% battery to spare. Seriously impressive.
Built on hardware you already trust
Bike IQ is designed around the strengths of the iPhone, delivering reliable performance ride after ride.

iPhone-class performance
Modern silicon, best-in-class sensors, and on-device intelligence.
All-day rides, covered
Optimized for long rides with consistent performance from start to finish.

Clean, focused experience
No clutter. No gimmicks. Just the data that matters.
Never trade the map for data
Build the pages you want from more than 150 tiles, and change them mid-ride. The map, the weather, your gears and the radar stay exactly where they are, on every one.
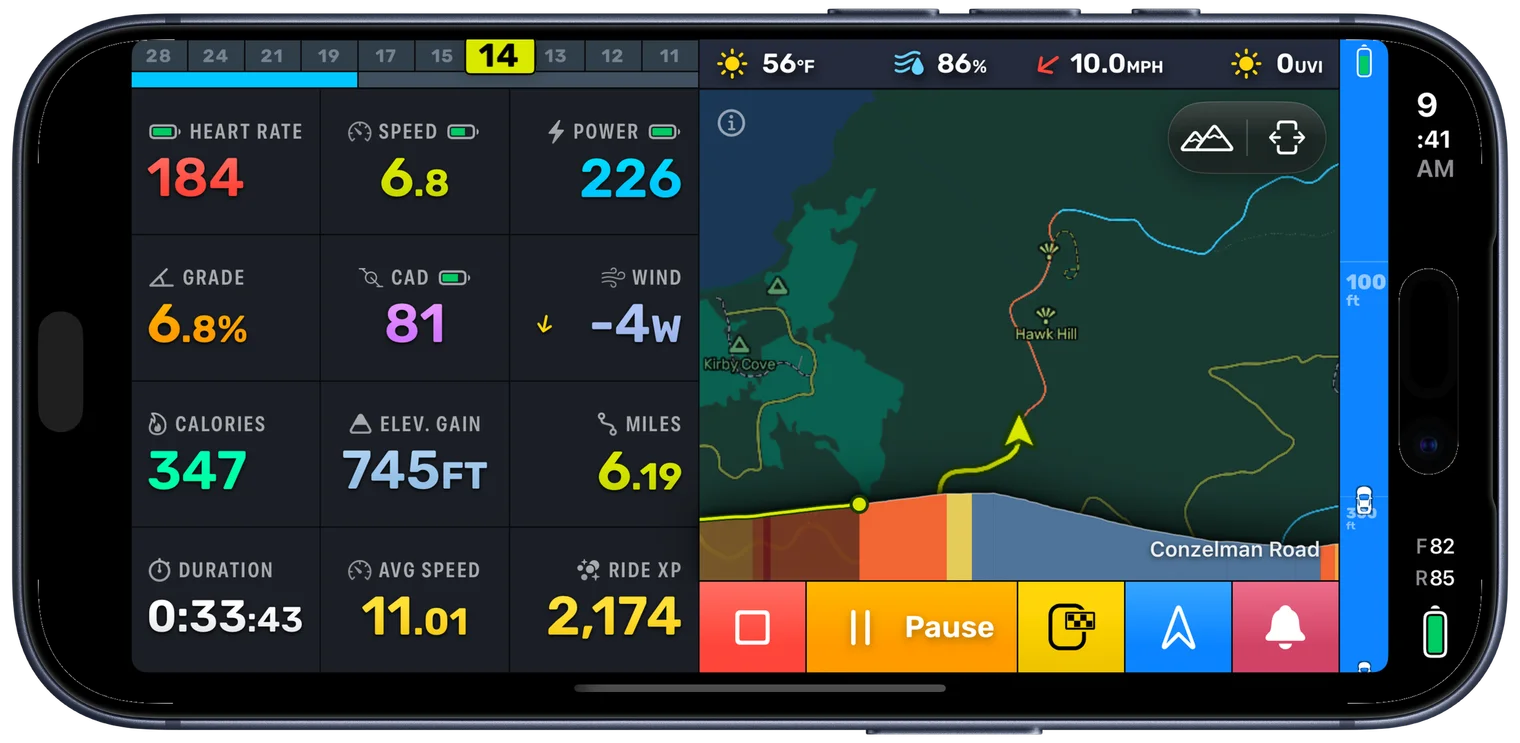
Where everyone starts
Default
Twelve metrics and the map, with nothing to set up. This is the page Bike IQ has always opened on, and the one every free rider rides.
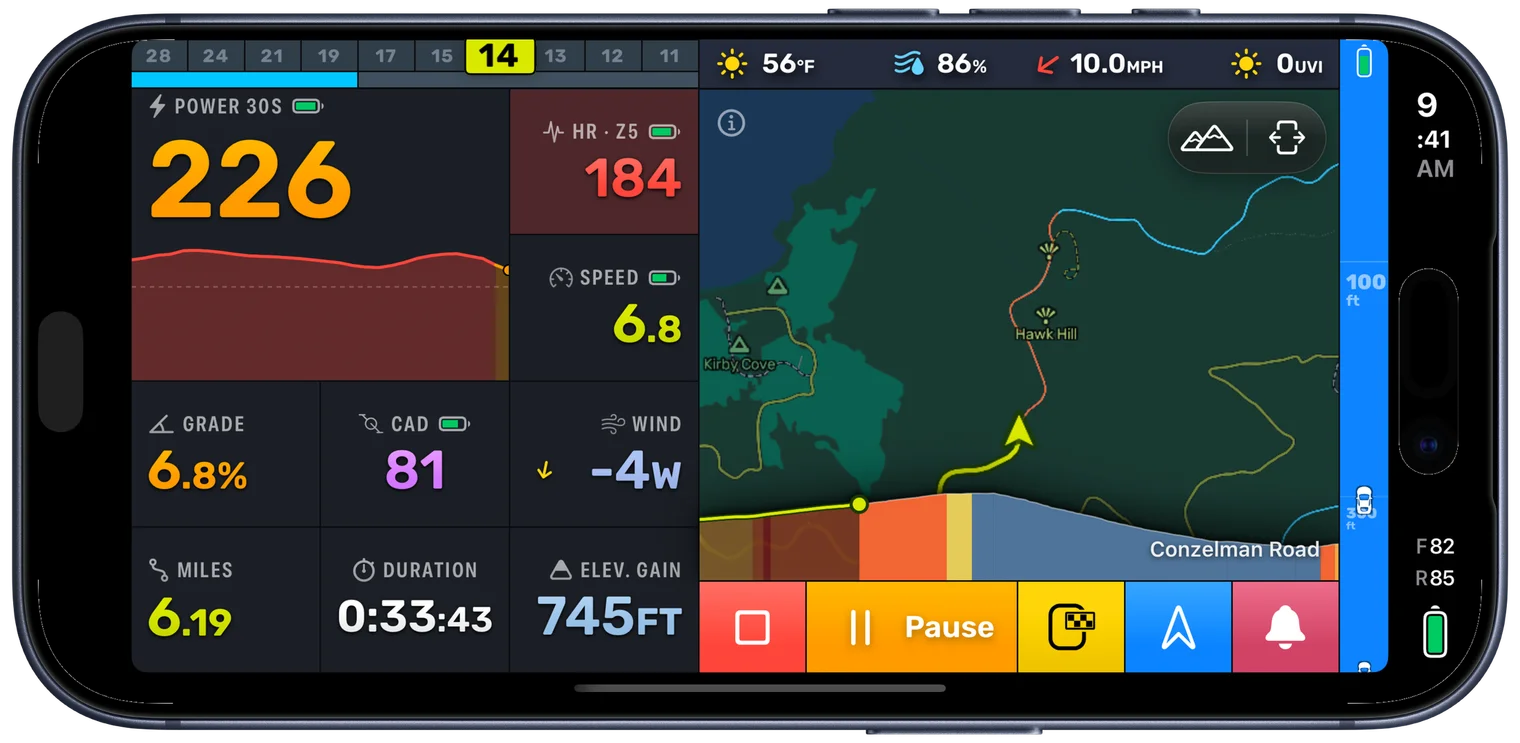
A page you build
Ride
Pick the metrics you want and the size each one gets. This page puts power on a graph, so you read the last minute rather than just this second.
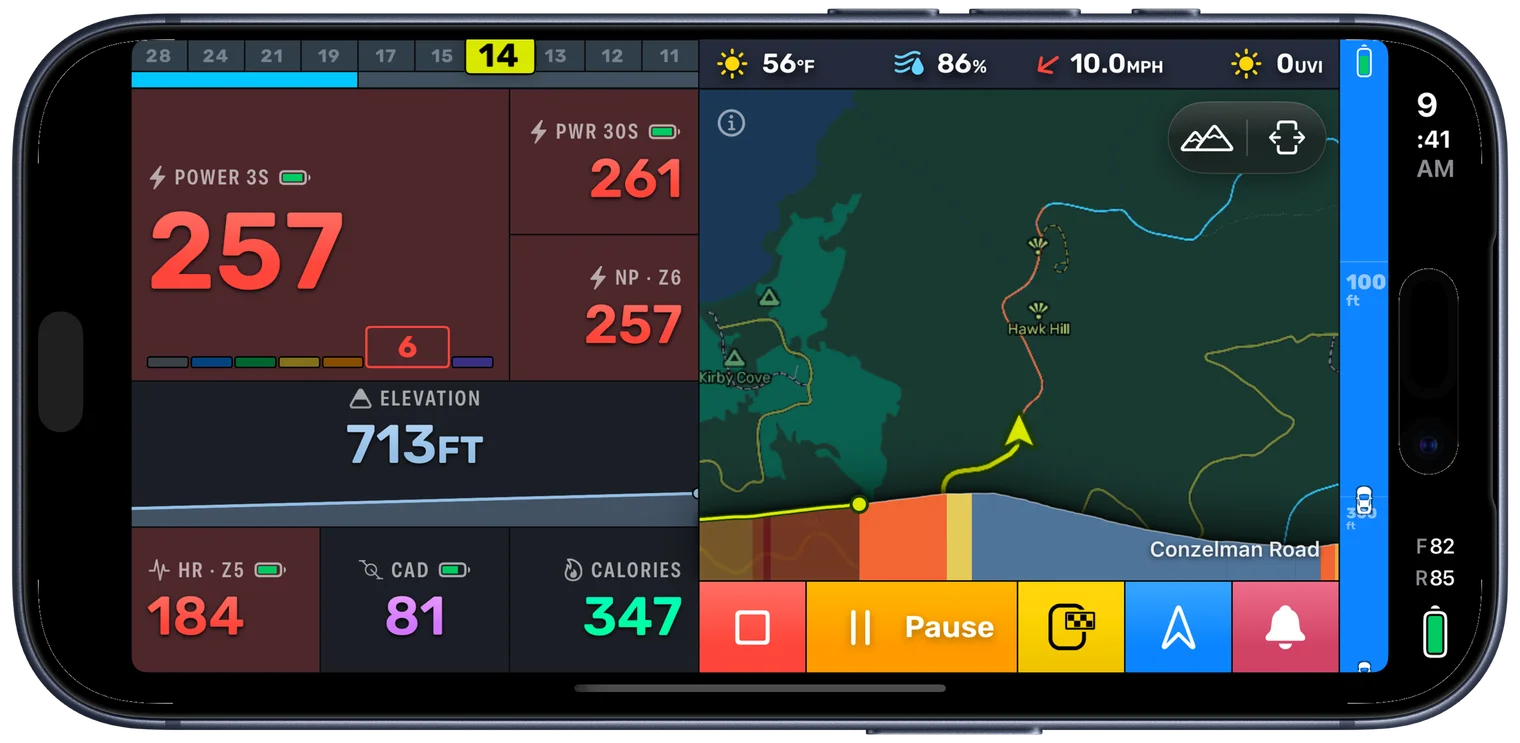
A page you build
Effort
Another, for intervals. Power over 3 and 30 seconds and normalized power, each coloured by the zone it lands in, over the ride's elevation profile.
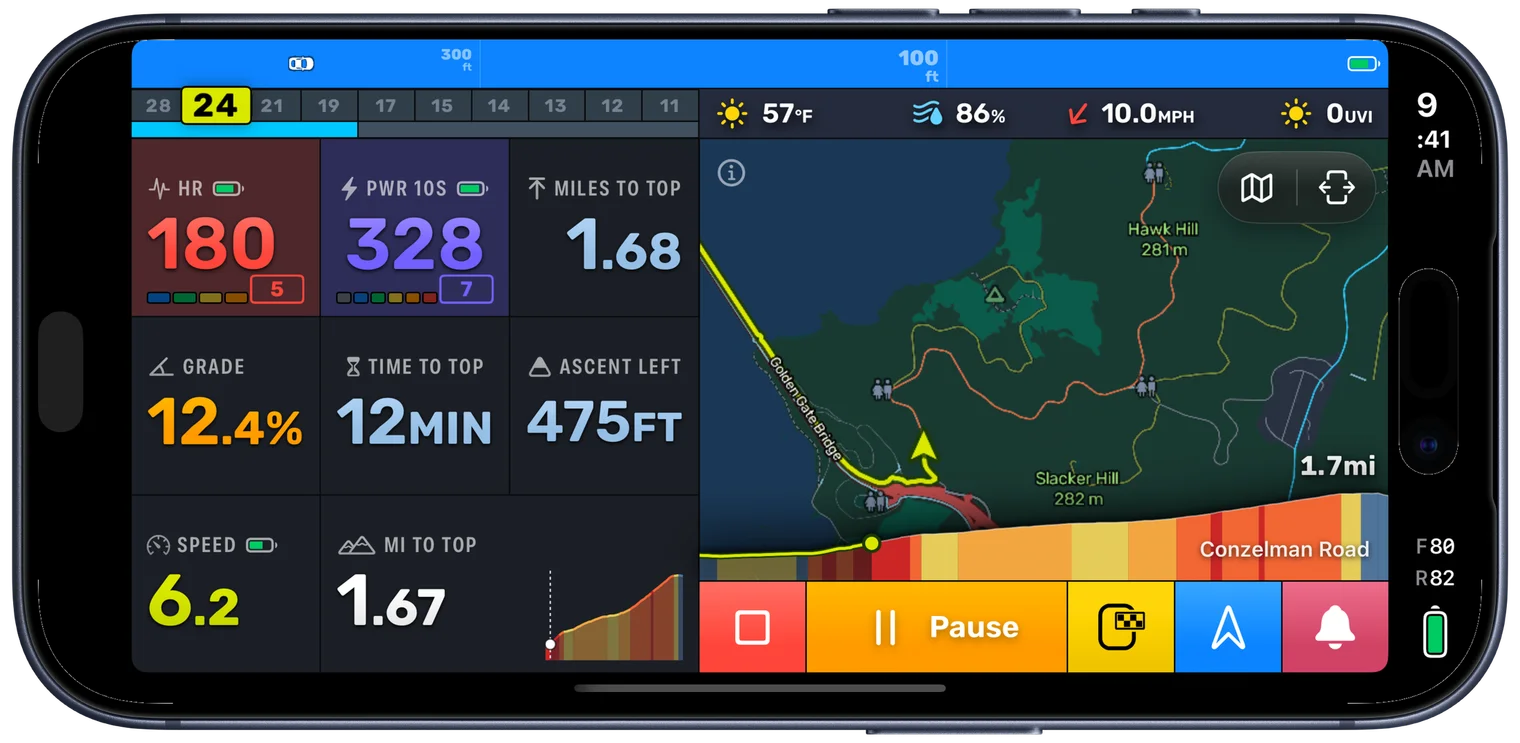
Comes up on its own
Climb
A page can carry conditions. This one appears when the road tilts up, swaps in what is left of the climb and the effort you are holding, and steps aside when it levels off.
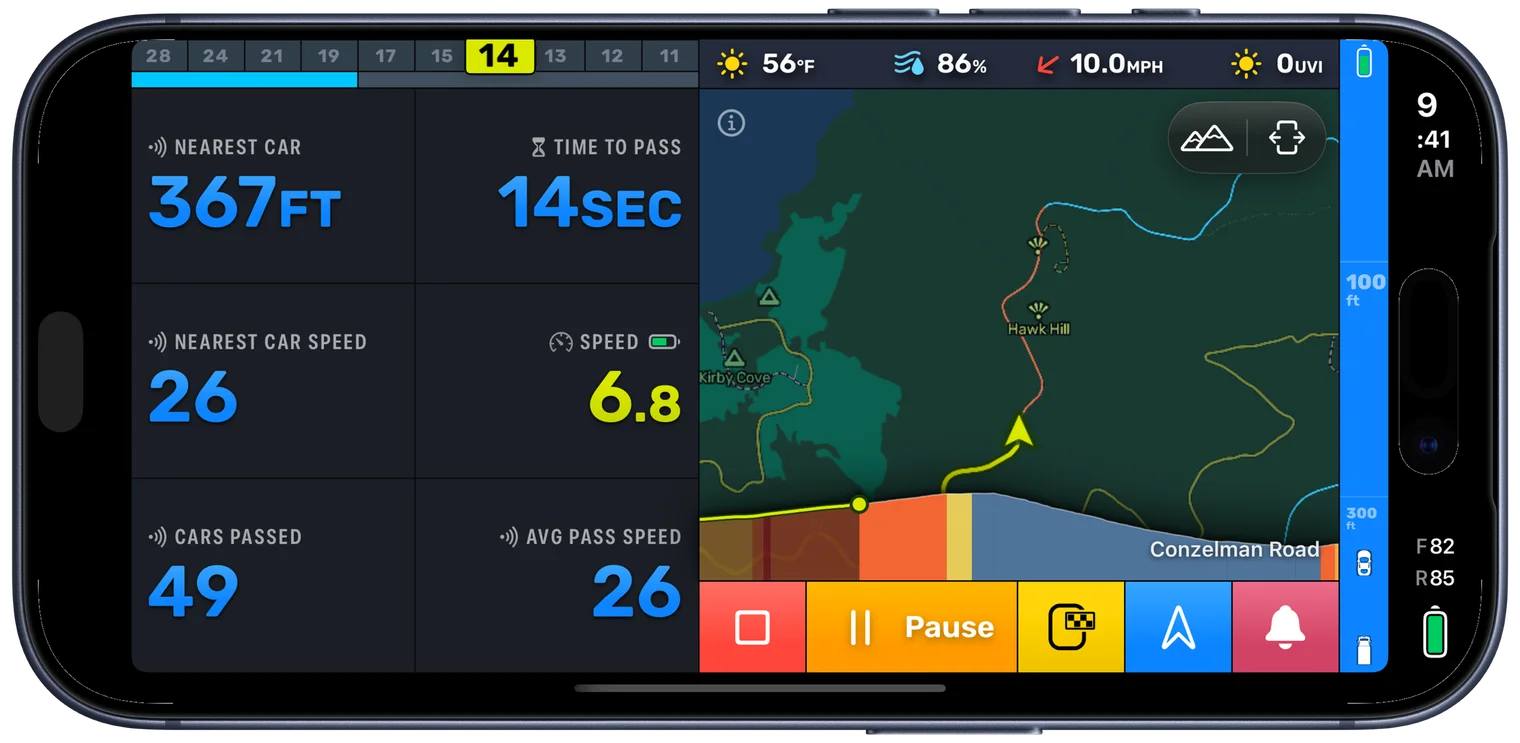
Comes up on its own
Busy Road
This one watches your radar. When cars have been passing often and fast, it brings the road behind you forward, then gives your page back once the traffic thins.
The Default page is free. Building your own, and letting them come up on their own, is part of Bike IQ Pro. How Smart Pages work.
Unpack your ride
Publish your ride, then explore the details that matter.


Ride summary
The full picture, at a glance.
Laps
Review and fine-tune after your ride.
Heart rate zones
Where your effort was spent.
Gear usage
How you used your gears.
Power curve
Your best efforts, across durations.
Power balance
How evenly you're producing power.
Pedaling dynamics
How much of the ride was real work.
Ride data
Every signal, over time.
Ride summary
The full picture, at a glance.
Laps
Review and fine-tune after your ride.
Heart rate zones
Where your effort was spent.
Gear usage
How you used your gears.
Power curve
Your best efforts, across durations.
Power balance
How evenly you're producing power.
Pedaling dynamics
How much of the ride was real work.
Ride data
Every signal, over time.
📍 Position Finder
Ready to ride smarter?
Download Bike IQ and see the difference real ride intelligence makes.
Free to try. No subscription required.