Getting Started with Bike IQ
Download to first ride in under five minutes. This guide covers installation, profile setup, optional sensor pairing, and what to expect on your first few rides.
Step 1: Download & Permissions
Bike IQ is on the iOS App Store. It requires iOS 18 or later, which covers the iPhone XR and XS and everything since, including both SE models. Grade, elevation, and estimated power work across all of them; an iPhone 12 or newer has the more precise altitude hardware, so its numbers settle fastest.
On first launch, the app requests three permissions:
- Location (Always): GPS tracking during rides. "Always" keeps recording if you lock your screen mid-ride.
- Motion & Fitness: Accelerometer and barometer access for grade estimation and virtual power calculation.
- Bluetooth: Required only if you pair external sensors. You can grant this later.
Step 2: Set Up Your Profile
Your profile contains the physical parameters that feed the power model. These are settings you enter manually, not sensor connections.
Body Weight
Enter your weight in kg or lbs. The physics model uses total system weight (rider + bike) to calculate the watts required at a given speed and gradient. Use your approximate riding weight (you in kit).
Bike Profile
Bike IQ supports multiple bike profiles, each with its own physics configuration:
- Bike Weight: in kg or lb, accessories included. Check your manufacturer's spec if unsure (a typical road bike is 7 to 10 kg).
- Tire Type: Slick or Knobby. Sets the rolling resistance the power model starts from.
- Tire Size: a starting point for wheel circumference, which calibrates itself if you pair a speed sensor.
- Handlebars: Flat bar, Drop bar or Aero bar. Sets your riding position, and with it the drag the model assumes.
These are starting points. The app refines your profile as you accumulate rides. See how the virtual power meter works for details.
Step 3: Pair Bluetooth Sensors (Optional)
Bike IQ works with zero external hardware. The virtual power meter estimates watts from your phone's built-in sensors and weather data starting from ride one.
If you own Bluetooth cycling sensors, pairing them adds live data streams and can improve the power model's calibration. Tap Connect Bluetooth Sensors, from your profile or from the bike you are setting up, and wake the sensor so it can be found: spin a crank, wear your HR strap, switch the radar on. Tap it when it appears under Nearby and Bike IQ files it in the right place.
Supported Sensors
- Power meter (Assioma, Quarq, Garmin Rally, etc.): real watt measurements displayed live, and used as ground truth to accelerate the physics model's calibration
- Heart rate monitor (chest strap, Garmin HRM, Wahoo TICKR, etc.): live heart rate and HR zone data, displayed alongside power and speed as an independent metric
- Cadence sensor: pedal RPM display and logging
- Speed sensor: wheel-speed backup for GPS speed
- Electronic groupset (SRAM AXS, Shimano Di2): live gear position, battery levels, and shift tracking
- Rear radar: vehicles approaching from behind, shown on the ride screen with audio alerts. See Supported Radars
- Tire pressure sensor: live pressure per wheel, with an alert before a slow leak becomes a flat
Heart rate is a standalone data stream from your Bluetooth HRM. It is not derived from power or speed, and it does not feed into the virtual power calculation. It's displayed as its own metric alongside your other ride data.
Step 4: The Ride Screen
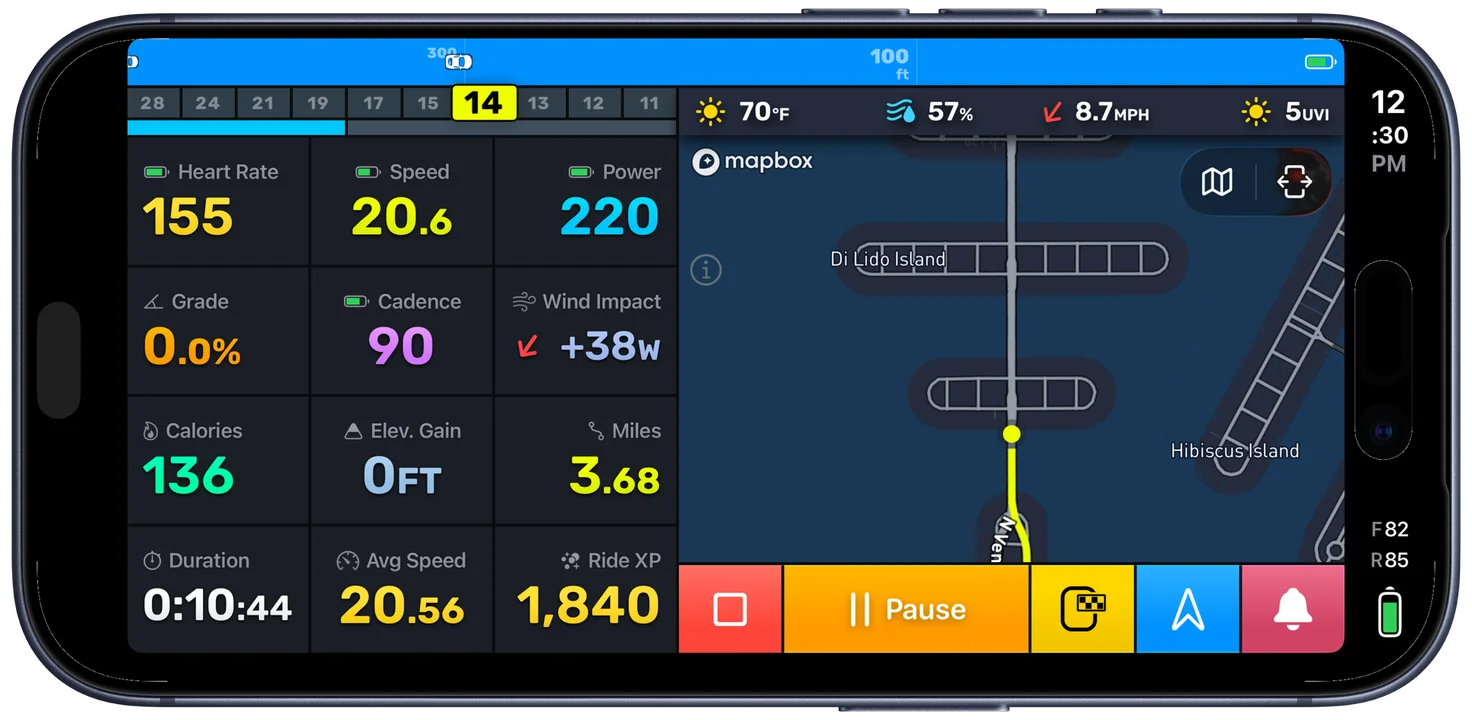
Bike IQ's core design: your numbers and the map, together, always. You can build your own pages and turn between them mid-ride, and the map, the weather and the controls stay put on every one. The page you start on shows:
- Live map with your position
- Current speed
- Estimated power (watts)
- Road grade (%)
- Distance and elapsed time
- Heart rate and cadence (from paired sensors)
- Wind speed and temperature
Every metric visible at a glance: during a climb, in a group, on a descent. One or two rides and the layout is second nature.
Once you are comfortable with it, Smart Pages lets you build pages of your own and turn between them mid-ride, and set conditions so a page comes up by itself on a climb or in traffic. Nothing about the screen above changes: the pages swap the metrics, and the map, the weather and the controls stay where they are.
Step 5: Your First Ride
Mount your iPhone on your bars (a Quadlock or similar stem mount works well. See the iPhone as bike computer guide for mount recommendations). Then:
- Open Bike IQ and wait for GPS lock (the map centers on your position)
- Open the garage and tap the bike you are riding
- Tap Start Ride
- Ride. The app handles everything.
- Tap End Ride when done
Rides save locally to your device immediately. No internet connection required.
Screen lock: If your iPhone screen times out mid-ride, GPS recording continues in the background. Wake the phone anytime to check your metrics.
Step 6: Reviewing Your Ride
After ending a ride, Bike IQ shows a post-ride summary with your key numbers: distance, moving time, average speed, elevation gain, calories, and power data. From here you can save the ride, discard it, or resume recording if you ended accidentally.
Saved rides go to the History tab, where you can tap any ride to open a detailed analysis with power curves, heart rate zones, elevation profiles, gear shift timelines, weather impact, and more. See the Ride Report guide for everything the report includes.
You can also publish rides to Strava, export them as GPX, FIT, or TCX files, and sync workout data to Apple Health.
Tips for Your First Few Rides
- Ride varied conditions. The physics model learns from your ride data. Hills, flats, wind, calm: more variety means faster calibration.
- Don't fixate on power accuracy on ride one. Estimates improve with each ride as the model calibrates to your actual aerodynamics. Treat the first few rides as calibration data.
- Wind is the biggest variable. Bike IQ pulls wind data at ride start. On gusty days, power estimates will be noisier; real-world gusts are inherently hard to model.
- Manage screen brightness on longer rides. The display is the biggest battery draw.
Related Guides
- Recording a Ride: everything about the ride screen, auto-pause, voice control, and more
- Virtual Power Meter: how the physics model works, what it learns, and what accuracy to expect
- Bluetooth Sensors: pair power meters, heart rate monitors, radar, and other cycling sensors
- iPhone as Bike Computer: mounts, battery life, and how Bike IQ compares to a Garmin or Wahoo
- Questions? contact@bikeiq.app