Weather & Wind Data
Wind is the invisible force that shapes every ride. Bike IQ measures it, quantifies its impact in watts, and factors it into your power data in real time. No other cycling app does this.
Weather Data on the Ride Screen
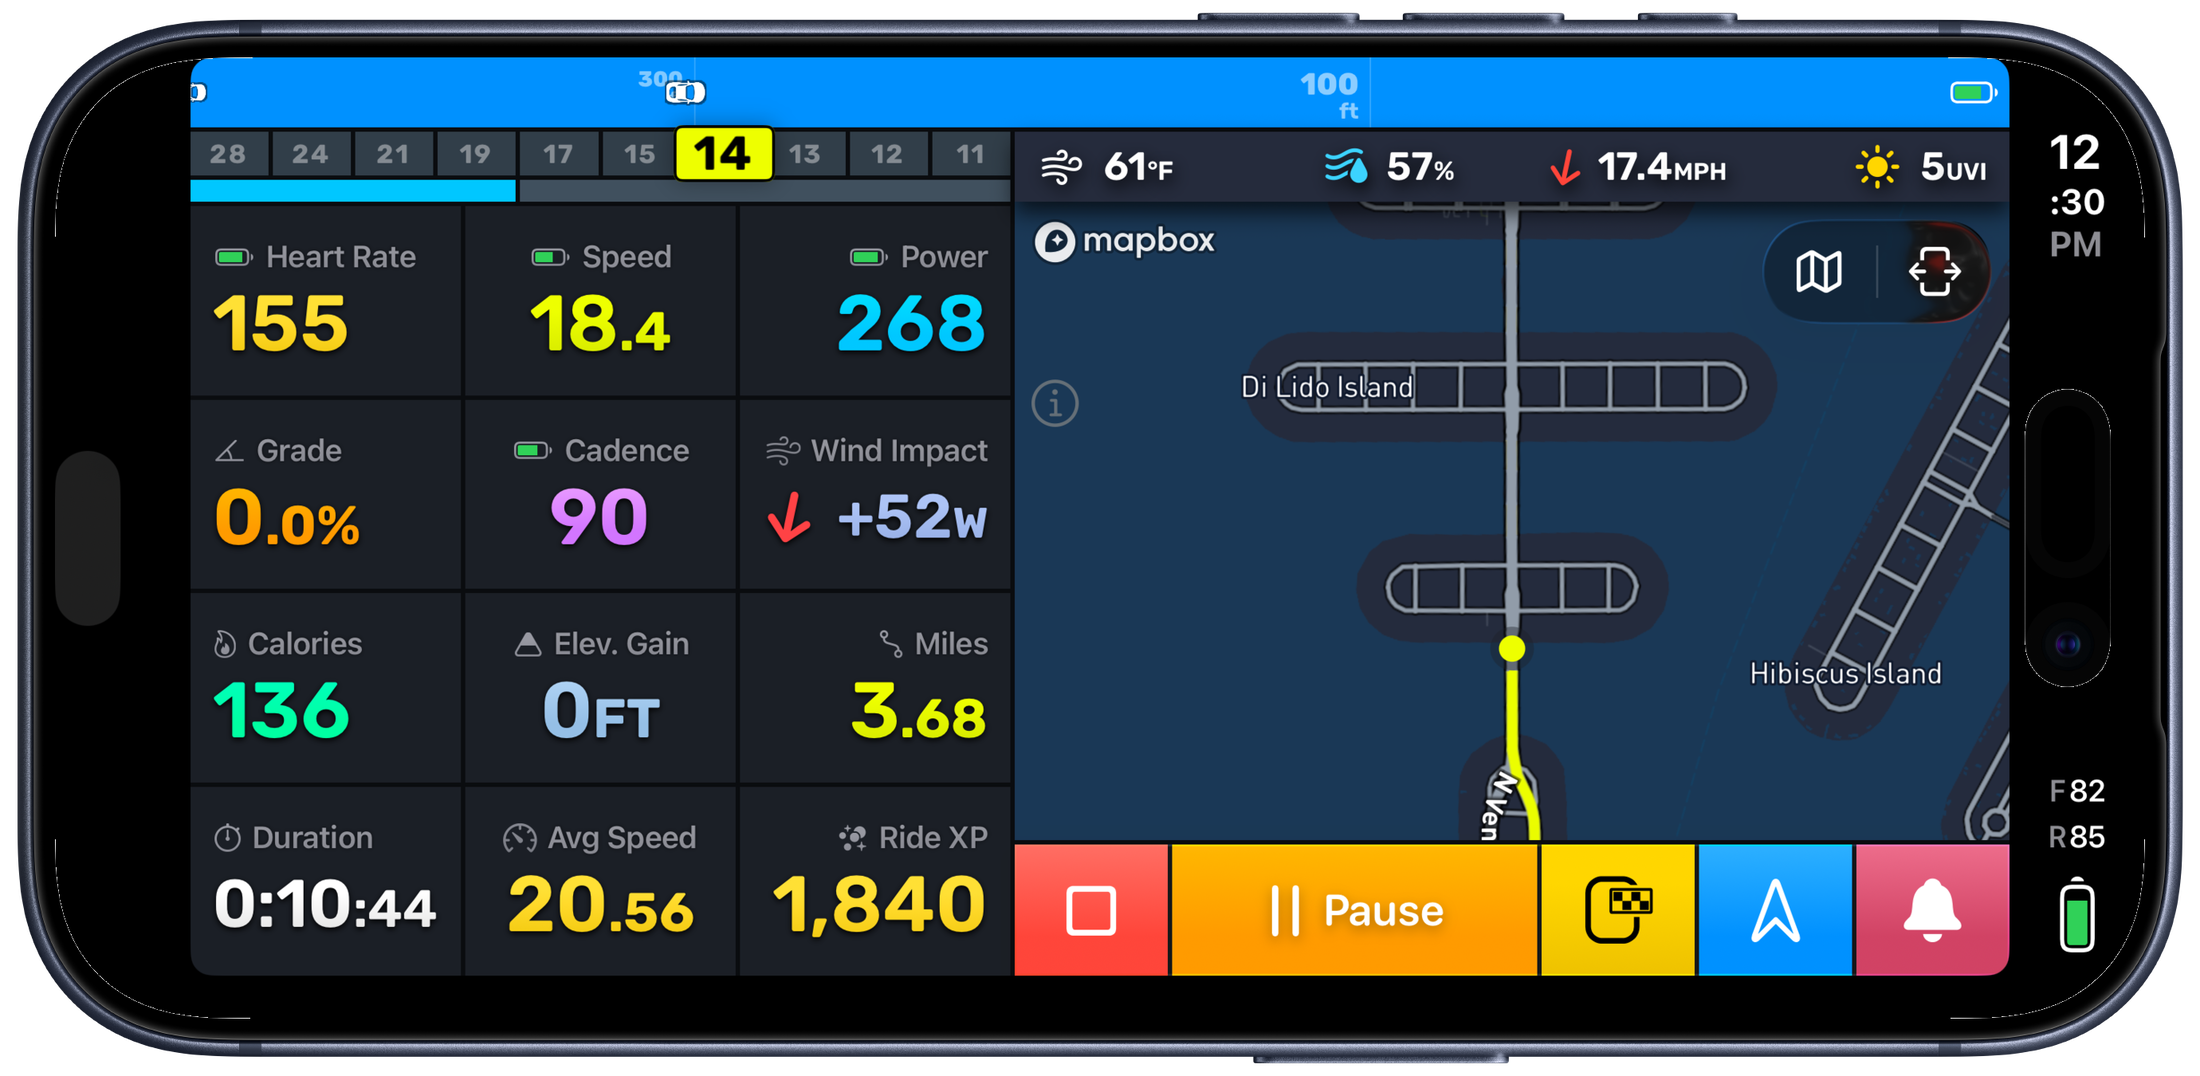
During every ride, Bike IQ displays live weather conditions pulled from a weather API at your current location. You'll see temperature, wind speed, wind direction, humidity, and UV index directly on the ride screen. Weather data updates approximately every minute, so you always have a current picture of conditions as they change throughout your ride.
This isn't just informational. The weather data feeds directly into the physics engine that powers your virtual power meter, making it a core part of how Bike IQ calculates your watts.
Wind Impact on Your Effort
This is where Bike IQ stands apart from every other cycling app. Rather than just showing you raw wind speed, Bike IQ calculates the wind's actual effect on your effort in real time:
- Headwind and tailwind component: based on your current riding direction versus the wind direction, Bike IQ breaks the wind into the component that's working against you (or helping you)
- Wind yaw angle: the angle between the wind and your direction of travel, shown relative to your heading rather than as a compass bearing. A yaw angle of 0 degrees means a pure headwind, 180 degrees means a pure tailwind, and 90 degrees means a crosswind hitting you from the side
- Watts of drag: the instantaneous additional (or saved) power required due to wind, calculated from aerodynamic drag equations. The wind impact widget displays this value in real time so you can see exactly how many watts the wind is costing or saving you at any moment
A 20 km/h headwind can add 50 or more watts to maintain the same speed. A tailwind of the same magnitude might save you 30 watts. Bike IQ shows you this in real time, turning an invisible force into a number you can act on.
Even crosswinds increase your effort. When wind hits you from the side, it creates a larger effective frontal area compared to still air. Your body and bike present more surface for the wind to push against, increasing aerodynamic drag even though the wind is not blowing directly against your direction of travel.
How Wind Affects Virtual Power
The virtual power meter uses real-time wind data as a primary input to its physics model. Wind speed and direction are factored into the aerodynamic drag calculation on every update. Without this data, power estimates on flat terrain would be significantly less accurate, because wind is the dominant variable when the road is level.
To put this in perspective: on flat terrain at 30 km/h, aerodynamic drag accounts for roughly 80% of the total resistance you pedal against. A 20 km/h headwind at that speed can add 50 or more watts to maintain your pace. Without accounting for wind, power estimates on flat roads would be unreliable — the difference between riding into a headwind and with a tailwind can easily be 80+ watts at the same speed.
The weather API provides wind data at your GPS coordinates, updated roughly every minute during your ride. Between updates, the most recent wind reading is used for power calculations. Real-world gusts that occur between readings introduce some noise into instantaneous power values, which is why you may notice more variation on gusty days. Over longer averaging windows of ten minutes or more, these effects smooth out and the power estimates tighten considerably.
Air Density and Altitude
Aerodynamic drag depends not just on wind speed but on air density. Bike IQ calculates air density from your altitude and current atmospheric conditions. At higher elevations, the air is thinner, which means less aerodynamic drag and fewer watts required for the same speed. If you ride at altitude, the physics model accounts for this automatically. You don't need to configure anything.
Post-Ride Weather Analysis
After your ride, the ride analysis screen includes a weather section that shows the conditions you rode through. Wind speed, wind direction, and temperature are recorded throughout the ride, giving you context for your performance.
This is particularly useful for understanding why a ride felt harder or easier than expected. A route you normally cruise at 30 km/h might have taken noticeably more effort because of a 25 km/h headwind on the way out. The weather data makes that visible instead of leaving you guessing.
Offline Behavior
Weather data requires an active cellular or WiFi connection. If you lose connectivity during a ride, weather conditions won't update until the connection is restored. Here's what happens to each feature:
- Power estimation: continues working using the last known weather data, or falls back to calm-wind defaults if no data was received
- Ride recording: fully functional offline, including GPS, gradient, speed, and all core ride metrics
- Weather display: shows the last received data until connectivity returns
Interpreting Wind Data
Understanding wind impact changes how you interpret your rides. A "slow" day might just be a windy day. A personal best on a familiar route might have had a generous tailwind. Seeing the wind impact in watts helps you separate your fitness from the conditions and make smarter decisions about pacing and effort.
Tip: On out-and-back routes, expect the headwind leg to feel significantly harder. Bike IQ's wind data helps you pace the outbound leg knowing you'll have assistance on the return.
Related Guides
- Virtual Power Meter: how real-time wind data feeds into the power model
- Map Display: map layers, color coding, and real-time overlays during rides