Bike IQ 1.4: Build Your Own Ride Screens
Until now the Bike IQ ride screen was twelve metrics in twelve fixed places. Good ones, chosen carefully, and the same for every rider whether they were racing a crit or riding to work. In 1.4 those cells are yours, there are more than 150 tiles to fill them with, and a page can come up by itself when the road asks for it.
What has not changed is the half of the screen that matters most. The map, the weather, your gears and the radar stay exactly where they are on every page you build.
Smart Pages
Open your profile, then Ride Settings, then Smart Pages. You start with three pages you swipe between and three that come up on their own, so there is nothing to set up before your next ride.
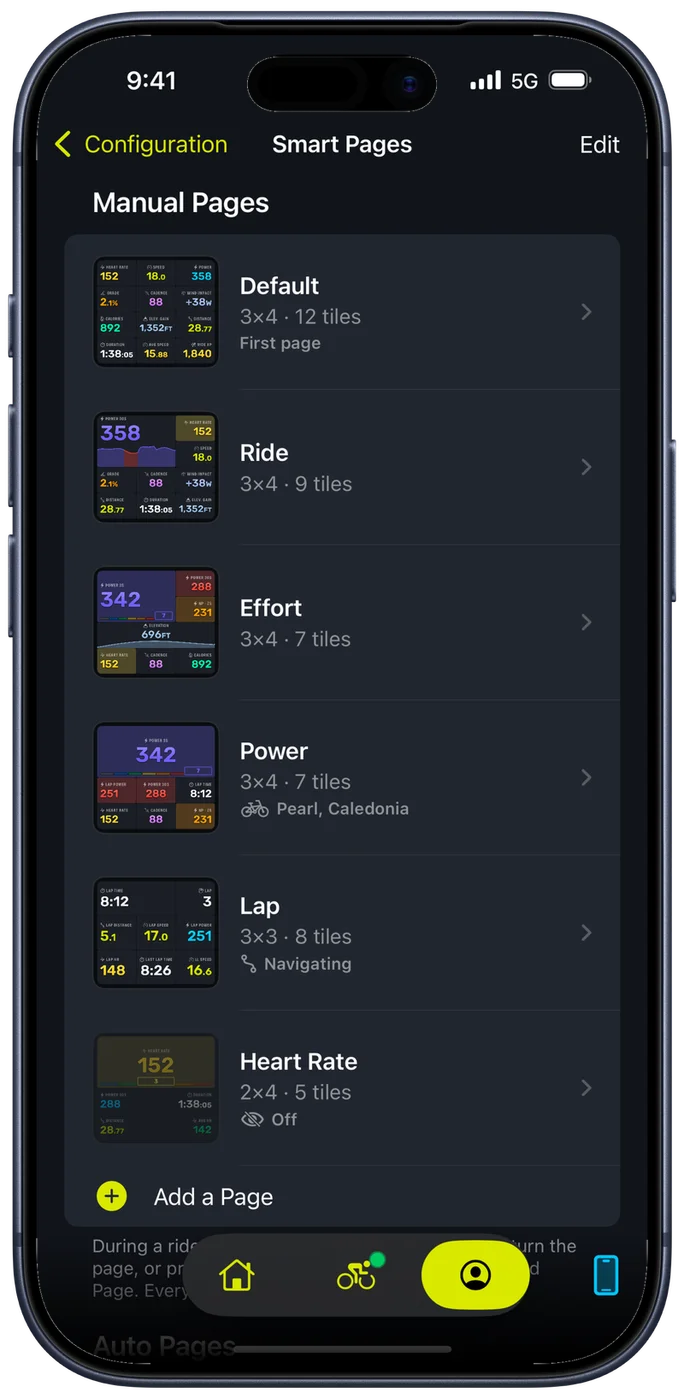
Default is the twelve-metric grid you already know. Ride puts power on a graph so you read the last minute and not just this second. Effort is power over 3 and 30 seconds with normalized power, each in its zone, over the ride's elevation profile.
Building one is a grid up to three columns by four rows. Tap a tile to change what it shows, drag it to move it, drag its corner to make it bigger, so the number you care about most can be the size it deserves.
Pages that come up by themselves
This is the part worth having. An Auto Page is not in the swipe order. It appears while its conditions are met and gives your page back when they end, so the numbers that matter on a climb are in front of you during the climb and not a swipe away.
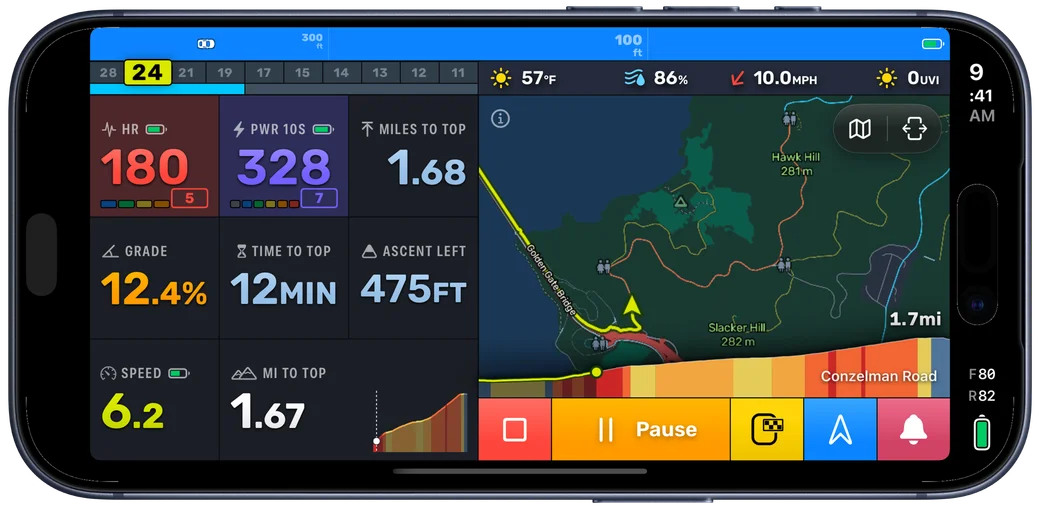
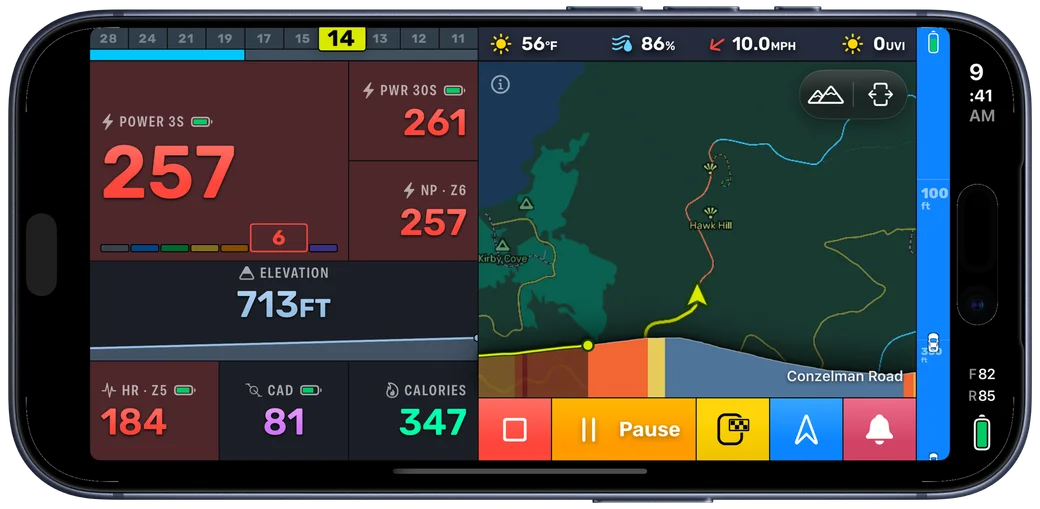
You start with Climb, Descent and Last Lap. Conditions come from seven groups: your effort, the terrain, the weather, navigation, traffic from your radar, the state of the ride, and your equipment. A page can carry up to six of them, require all or any to be true, and hold for a number of seconds so a single reading never flips a page.
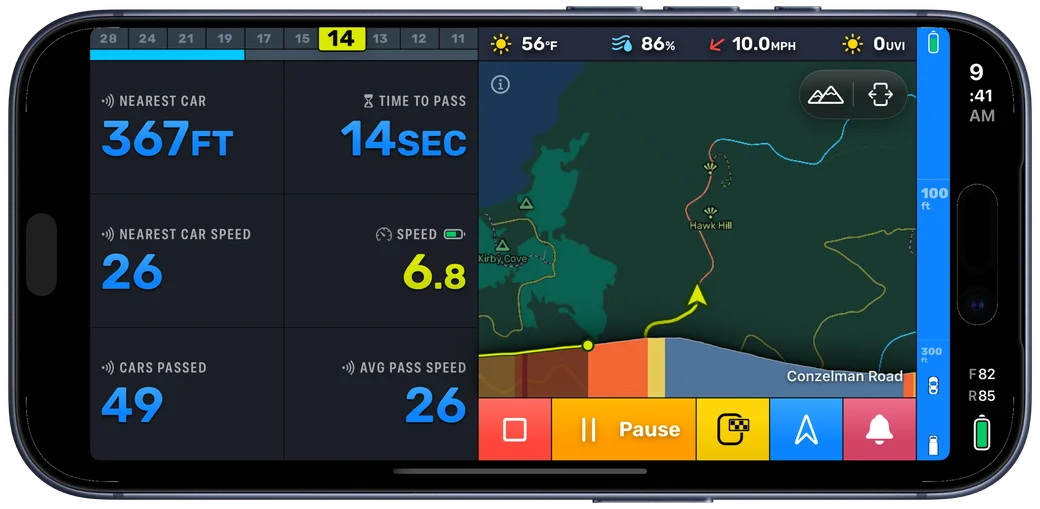
Building and previewing pages is free. Showing them on a ride is part of Bike IQ Pro, and without Pro your rides use the Default page exactly as before. The full guide is in Smart Pages.
Twelve tiles became more than 150
This is the part that is easy to undersell. Until now the ride screen was twelve metrics, in twelve fixed places, the same for everyone. Bike IQ chose them and you lived with them. In 1.4 those twelve cells are yours, and there are more than 150 tiles to put in them.
Most metrics come in more than one form, which is where the number comes from. Power alone is instant, a rolling average over 3, 5, 10 or 30 seconds, a lap or ride average, normalized, per kilogram, as a percentage of FTP, or as a zone. One search gets you all of them at once, with their live values beside them.
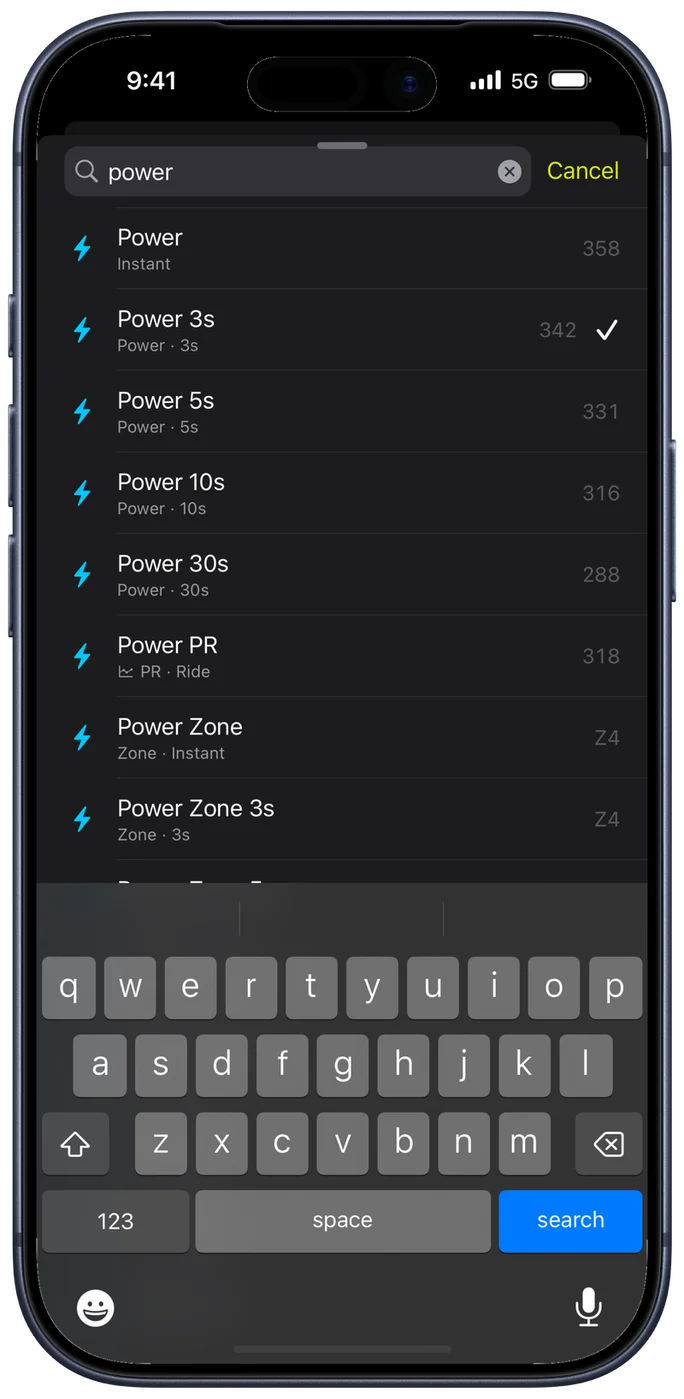
The more interesting ones do not print a number at all.
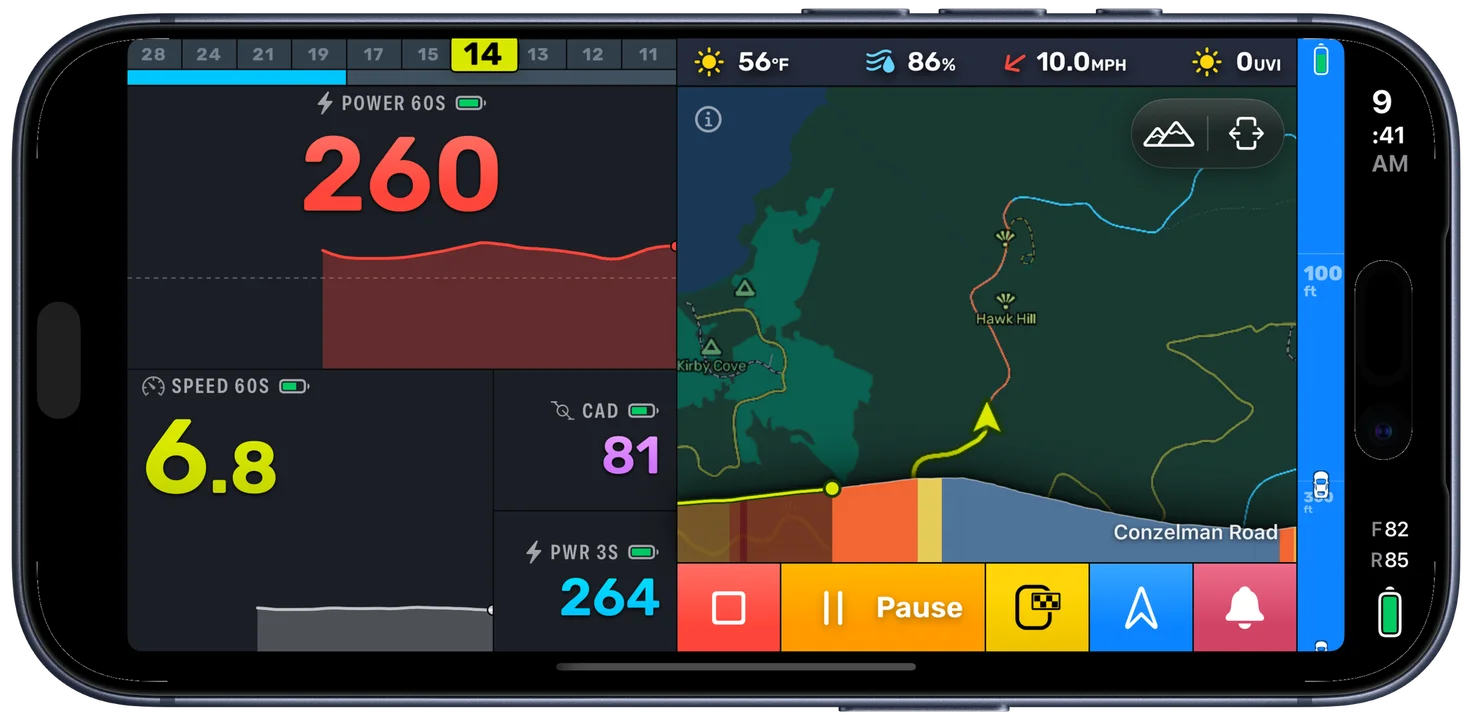
Graphs keep the big value and draw its recent history underneath, for power, heart rate, speed and cadence, plus the elevation profile of the ride so far. A number tells you where you are. The shape under it tells you whether you are fading.
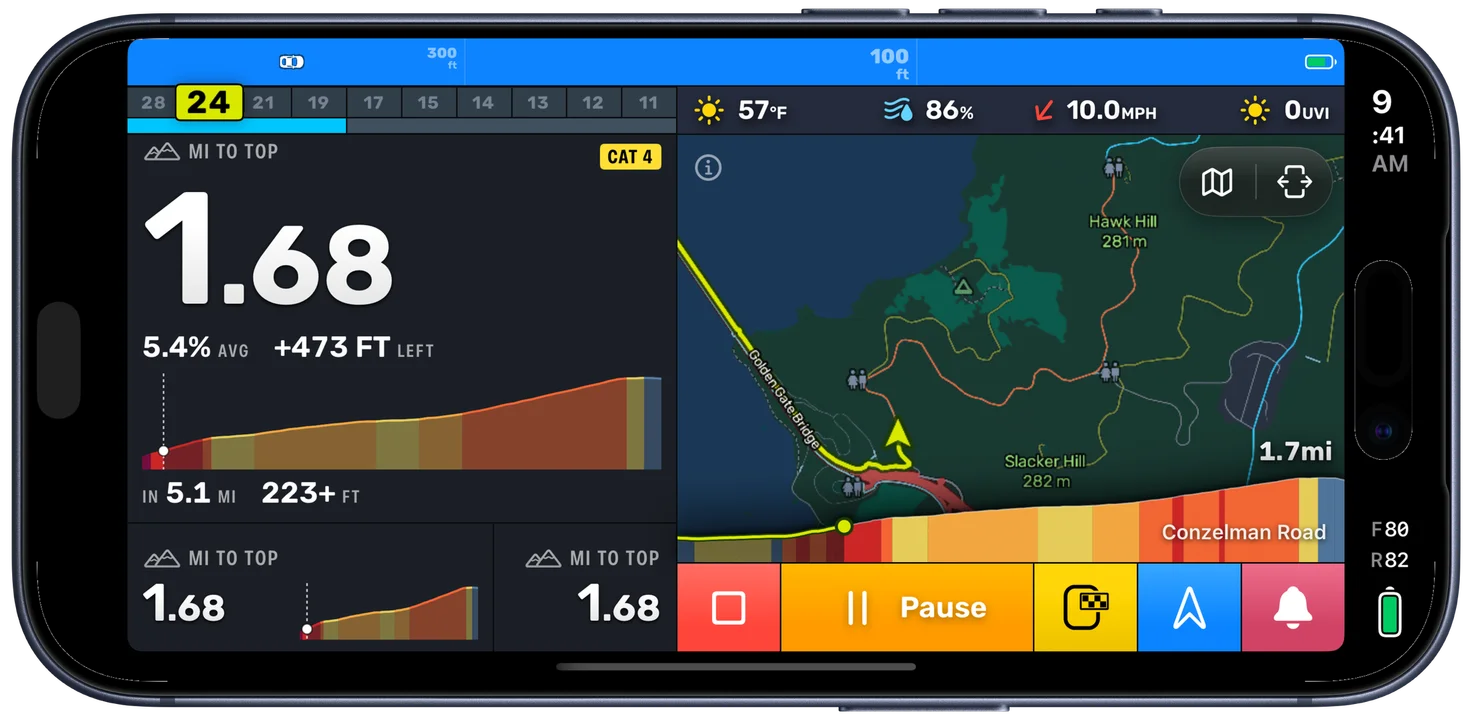
Climbs lists every climb still ahead of you, numbered along a route and shaded by gradient, so the steep part is visible before you reach it. The hill tiles beside it count down what is left of the one you are on: Time to Top, Ascent Left, Descent Left, and the VAM you are climbing at.
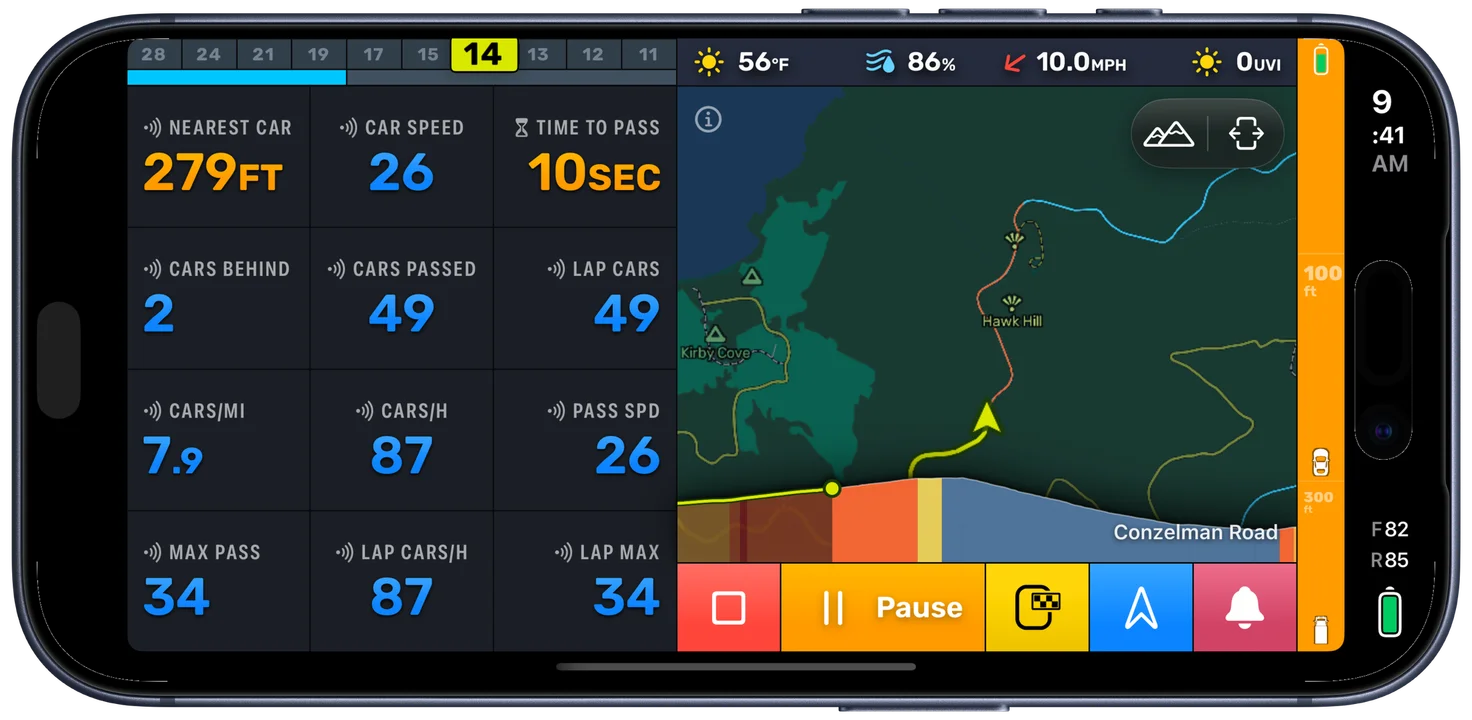
Radar tiles turn the strip down the edge of your screen into numbers: the nearest car, its speed, how long until it passes, how many have gone by, how often, and how fast. They are what the Busy Road page above is built from.
Power PR and Speed PR draw this ride against your best of the last three months as a bar chart, over the durations and distances Strava measures. Bars you have beaten turn gold and a new best pulses as it lands, so a personal record is something you notice while you are setting it rather than something you read about afterwards. Alongside them, Best power and Fastest distance track this ride's own records as plain numbers: best 30 second, 1 minute, 5 minute and 20 minute power, fastest 10, 20, 40 and 100 km, in miles too.
Then the ones that simply had nowhere to live before: tire pressure for both wheels, battery for your phone, groupset, sensors and e-bike, a gear tile that draws your cassette with the current cog marked, weather including a signed headwind, and the e-bike tiles below.
E-bikes
Bike IQ now reads TQ HPR40 and HPR50 drives. You get the motor's power, the assist mode and the e-bike's battery, and the drive doubles as a power, cadence and speed sensor. Your own power and the motor's are kept apart: only your watts go to Strava and Apple Health, and only your watts count toward your FTP. The ride report shows the two side by side for the ride and for each lap.
Bike settings has an E-Bike row under Sensors to connect one. If your e-bike is not supported yet, Can't find your sensor? sends us the request along with what your bike is broadcasting, which is how new drives get added.
Sensors
- Quarq and Zipp TyreWiz joins the tire pressure sensors Bike IQ reads, alongside the RideNow TPMS 1.0 and the Tubolito SYNCD. There is a page for all three now.
- Two heart rate straps can both be assigned to you, and Bike IQ follows whichever one you are actually wearing. Grab either on the way out of the door.
- Radar tracking was rebuilt. Bike IQ now works out which reading belongs to which car by matching them between frames instead of trusting their position in the radar's list. Fewer duplicates, fewer cars that vanish and come back as new ones, steadier closing speed, and a car's speed is only shown once a second reading agrees with the first.
- Tiles name their source, so you can tell that heart rate is coming from the strap rather than the Watch, or which sensor is driving your gears.
Apple Watch
The Watch screens editor is rebuilt. Profile, Apple Watch, Configure Screens now gives you one section per Watch screen, up to four metrics each and up to six screens. Tap a metric to swap it, drag to reorder within a screen or between screens, and leave off the ones you do not read. Until now all fourteen metrics were always on your wrist whether you wanted them or not.
Strava and Apple Health
Bike IQ can now import rides from Apple Health, which is the way to bring over rides recorded on your Apple Watch or in another app. It marks the ones that look like duplicates of rides you already have. Only rides with GPS can be imported, since without a route there is nothing to draw or analyze.
Disconnecting Strava now also revokes Bike IQ's access on Strava's side, rather than only forgetting the connection on your phone.
Fixes
What Strava and Health receive. No more power spikes in exported rides, because exports now carry one trackpoint per second. Coasting cadence goes over as 0 rather than disappearing. GPX files carry the real ride time. Apple Health and Fitness show moving time and the right average speed.
Climbs, wind and voice. Climb detection no longer splits one climb in two when you ease off for a breather, and no longer reads a gap in elevation data as a hill. Headwind reads the wind rather than your own speed. The navigation voice no longer pumps in volume, and the voice you chose speaks from the first announcement rather than the second.
Sensors. A Magene radar is never mistakenly driven as a heart rate belt. Tubolito beacons are found again after iOS changes the id it reports them under.
Getting it
1.4 is on the App Store. Smart Pages needs Bike IQ Pro to show your pages on a ride; everything else here is free.